

Release Date :
Reference Number :
WPR-2025-261
Headline Inflation
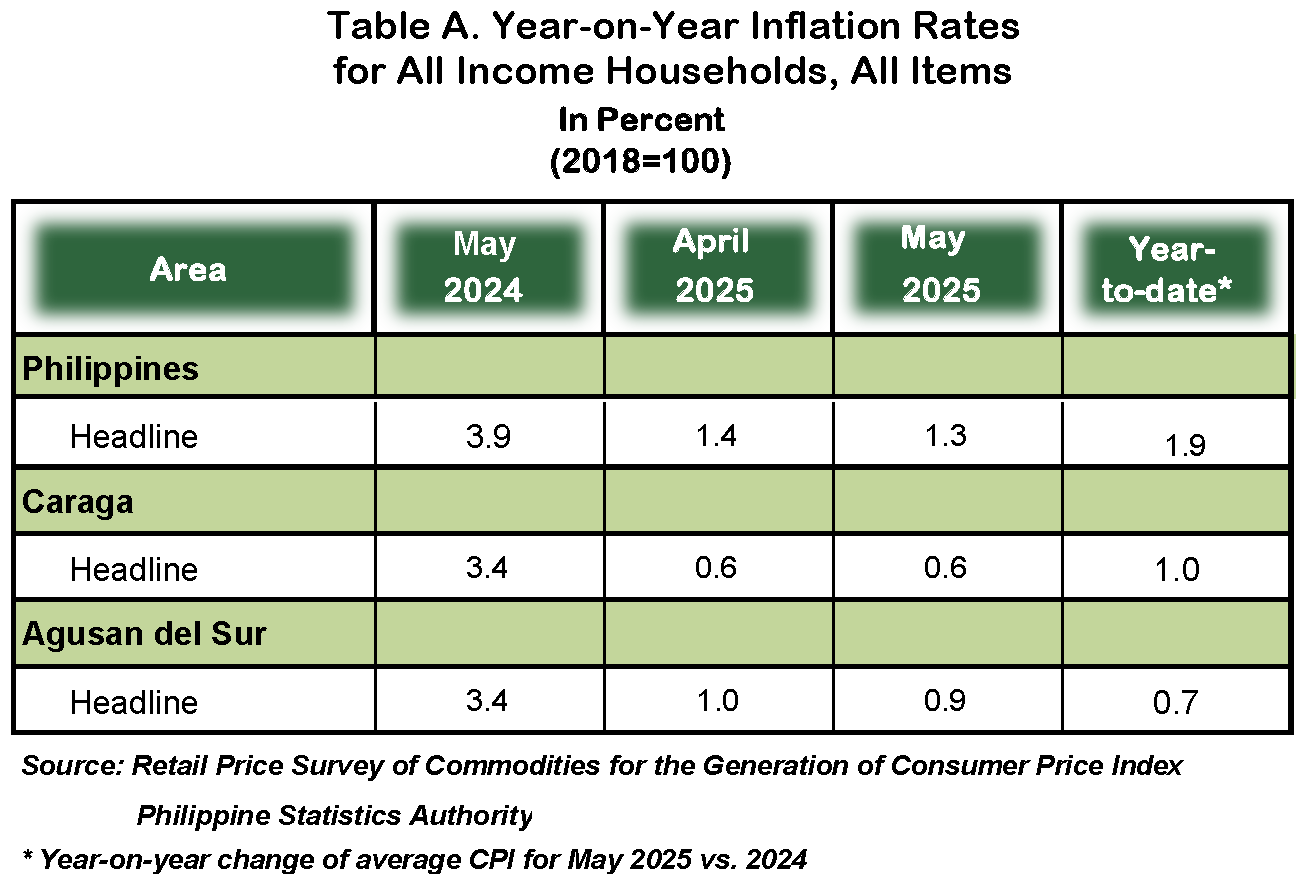
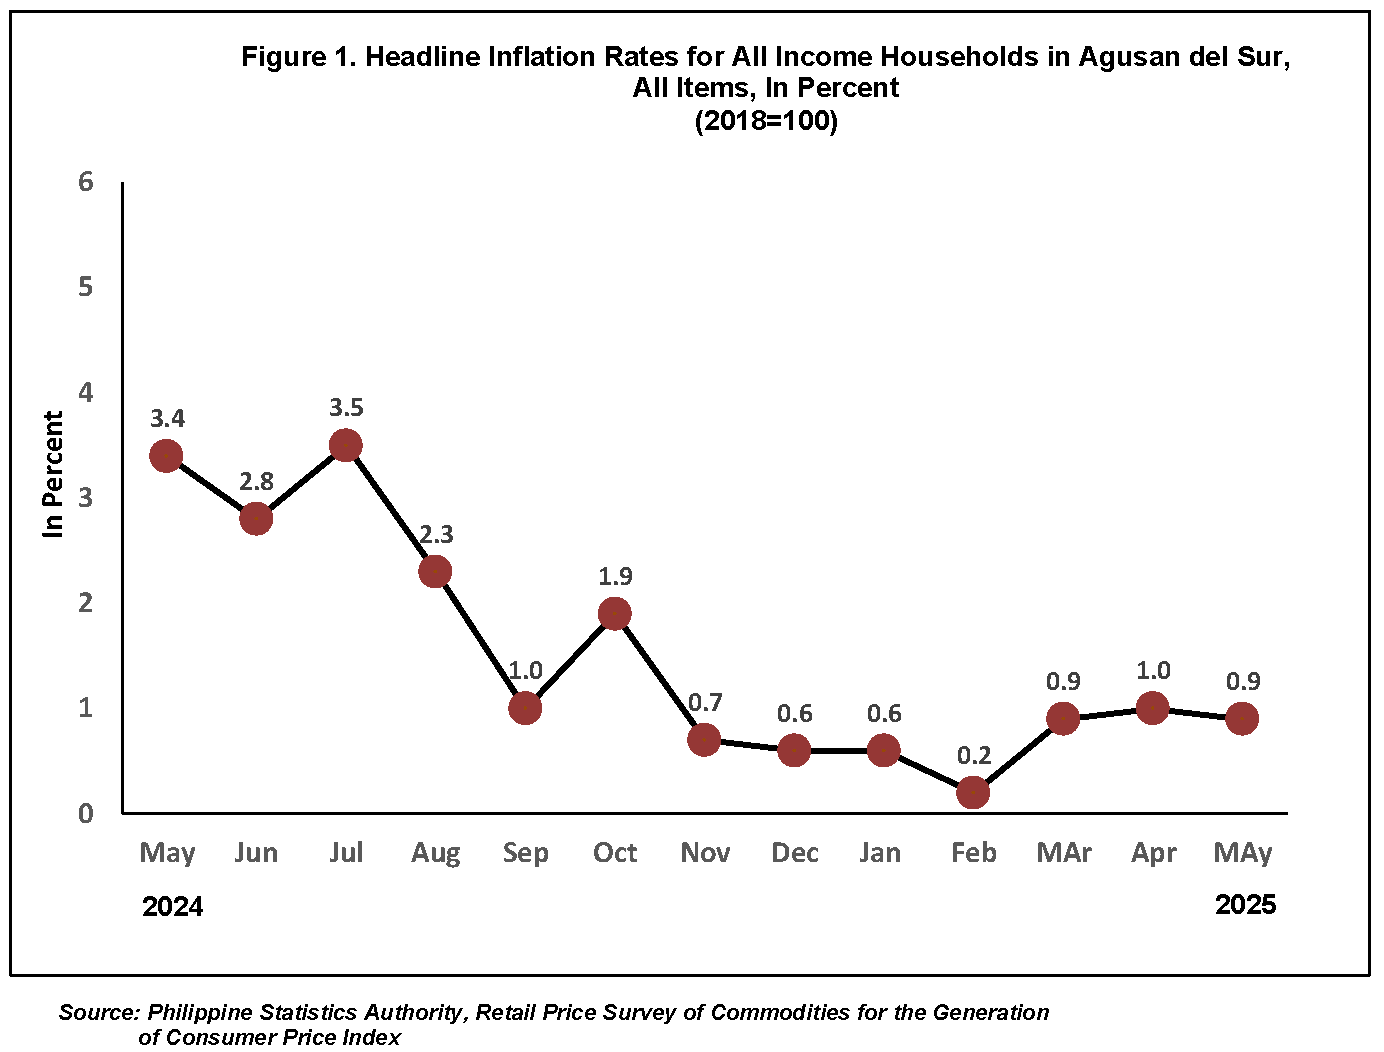
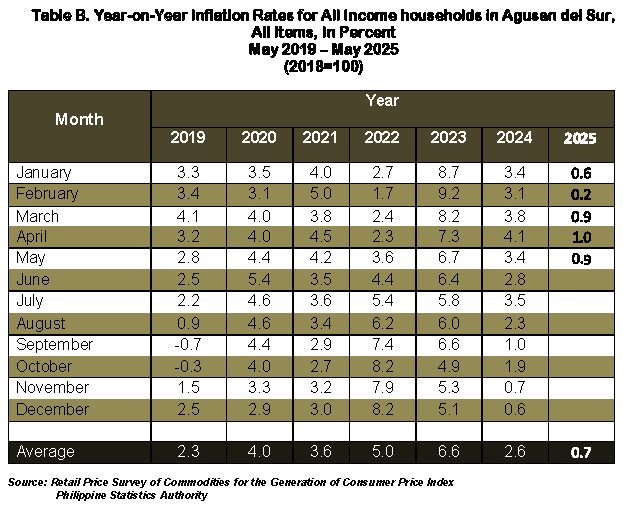
The headline inflation for all income households in the province of Agusan del Sur slightly decreased to 0.9 percent in May 2025 from 1.0 percent in April 2025. Inflation in May 2024 was higher at 3.4 percent.
For comparison, the provincial headline inflation for all income households in May 2025 is faster than the regional inflation at 0.6 percent while slower than the national inflation at 1.3 percent.
Among the 13 commodity groups, three groups exhibited a decreasing inflation in May 2025. This was highly influenced by Food and Non-alcoholic Beverages, -0.6 percent from -0.1 percent; Health, 8.3 percent from 8.5 percent and Transport, -3.5 percent from
-2.7 percent.
In contrast, a higher annual growth rate was observed in the indices of the following:
a) Housing, Water, Electricity, Gas and other fuels, 3.6 percent from 2.2 percent;
b) Furnishings, household equipment and routine maintenance, 1.2 percent from 1.1 percent and
c) Recreation, Sport and Culture, 3.2 percent from 3.0 percent.
The rest of the commodity groups that maintained steady rates were reported in the indices of the following:
a) Alcoholic Beverages and Tobacco, 6.2 percent;
b) Clothing and Footwear, 1.2 percent;
c) Information and Communication, 1.6 percent;
d) Education Services, 0.3 percent;
e) Restaurants and Accommodation Services, 4.8 percent;
f) Financial Services, 0.0 percent and
g) Personal care and miscellaneous goods and services, 2.1 percent.
Food Inflation
Food inflation for all income households at the provincial level further reduced to -1.0 percent in May 2025 from -0.4 percent in April 2025. In May 2024, food inflation was higher at 8.9 percent.
The decline on inflation for food in May 2025 was essentially caused by the lower year-on- year growth rate on Cereals and cereal products, -10.3 percent from -8.1 percent; Vegetables, tubers, plantains, cooking bananas and pulses, 8.8 percent from 10.5 percent and Sugar, confectionery and desserts, 4.3 percent from 7.5 percent.
Similarly, lower year-on-year growth rates were depicted in the food groups of the following;
a) Fruits and nuts, 8.3 percent from 9.7 percent;
b) Milk, other dairy products and eggs, 4.4 percent from 5.1 percent;
c) Oils and fats, 12.1 percent from 16.9 percent and
d) Meat and other parts of slaughtered land animals, 5.7 percent from 5.8 percent.
Meanwhile, food group on Fish and other seafood posted an increase in inflation rate at
8.0 percent from -2.0 percent during the month.
Food group on Ready-made food and other food products maintained at 3.2 percent.
(Sgd.) DEMETRIO T. DEJOLDE JR.
Chief Statistical Specialist
| Attachment | Size |
|---|---|
|
|
375.99 KB |