

Release Date :
Reference Number :
WPR-2025-314
A. Caraga
1. Overall Inflation
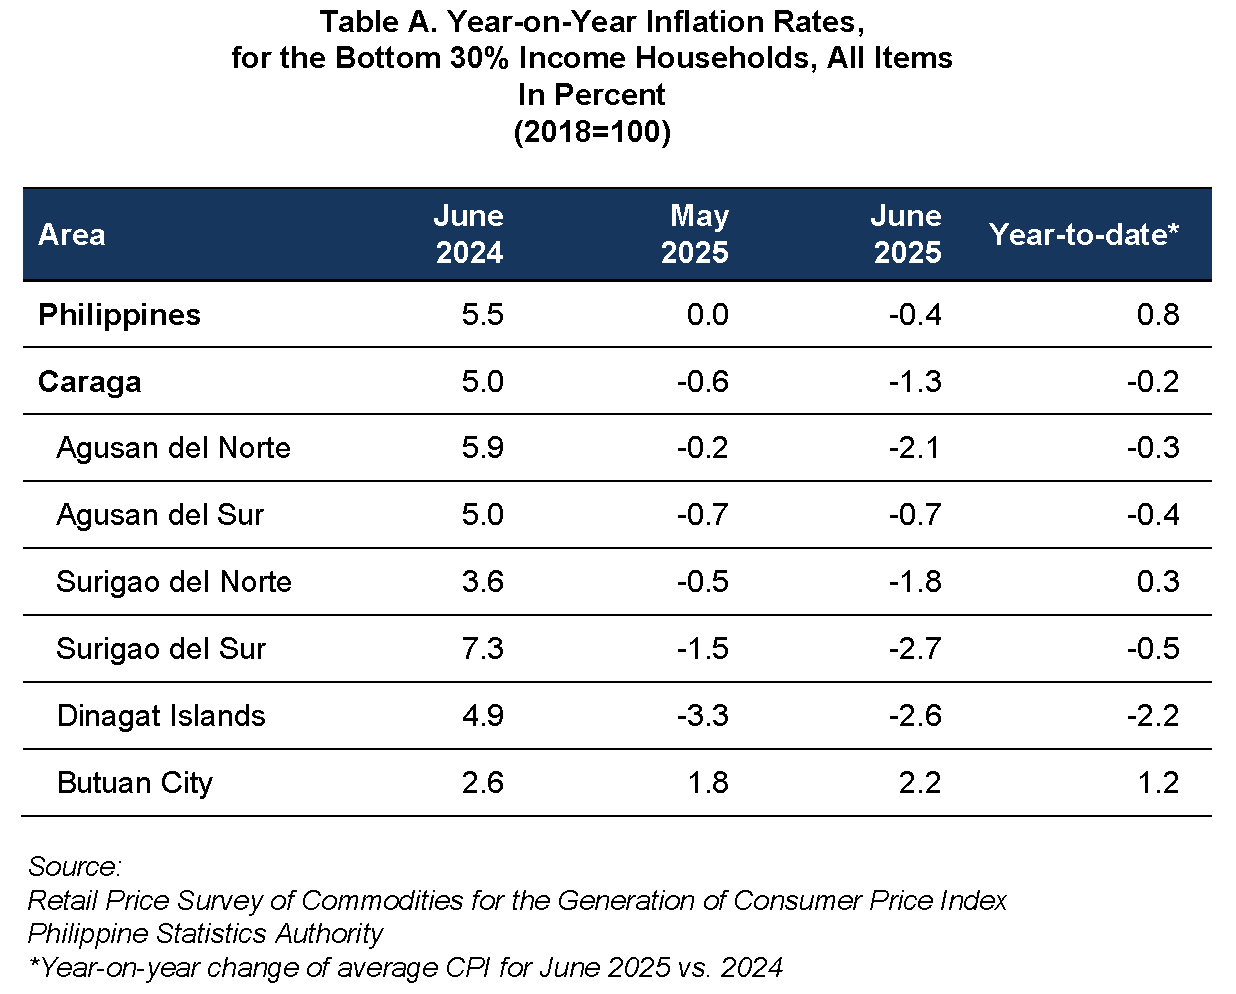
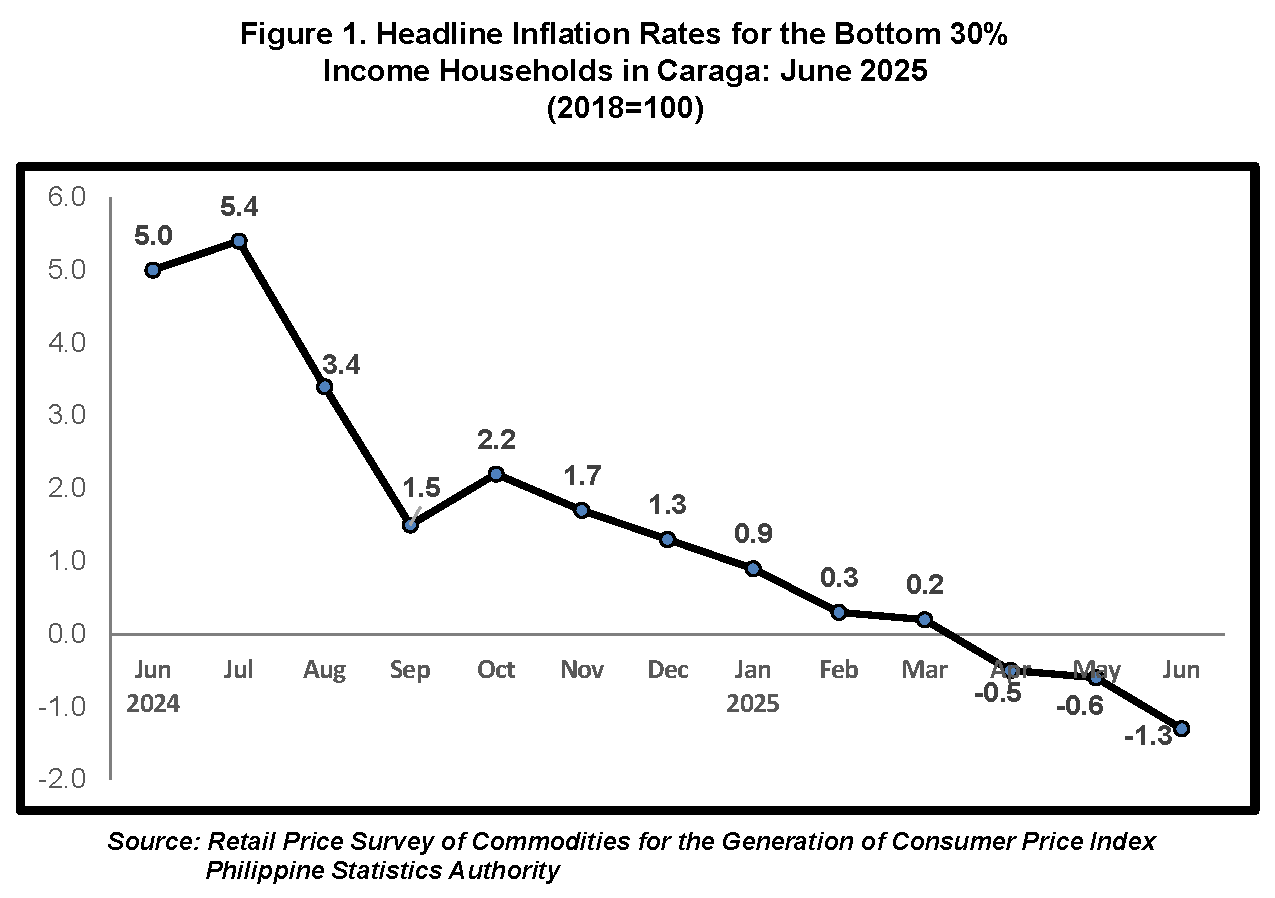
Inflation Rate for Bottom 30% Income Households Further Declines to -1.3 percent in June 2025
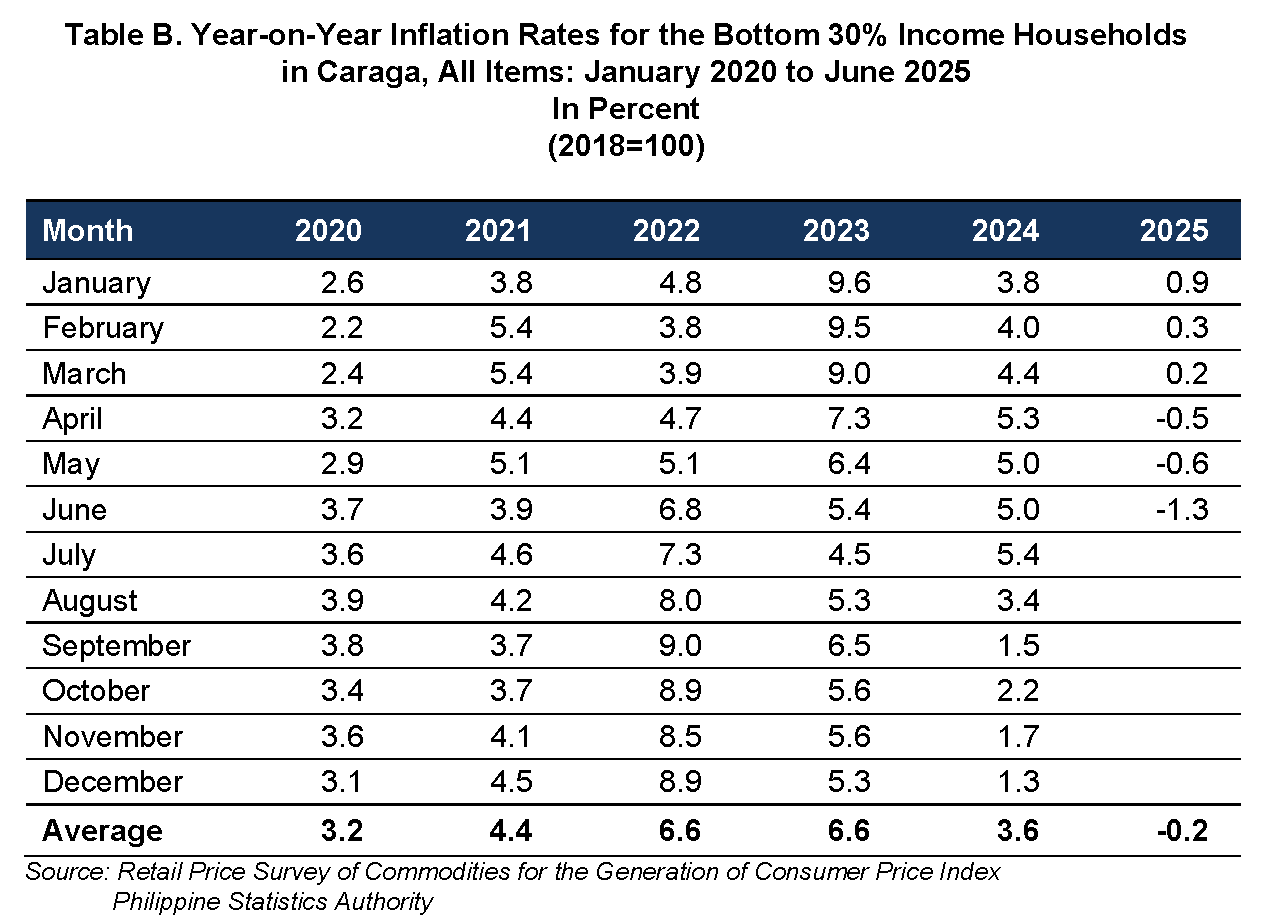
The inflation rate for the bottom 30% income households in the region further declined to -1.3 percent in June 2025, down from -0.6 percent in May 2025. This marks a significant drop compared to the 5.0 percent inflation rate recorded in June 2024, reflecting improved price conditions for low-income households in the region (Refer to Table A and Figure 1).
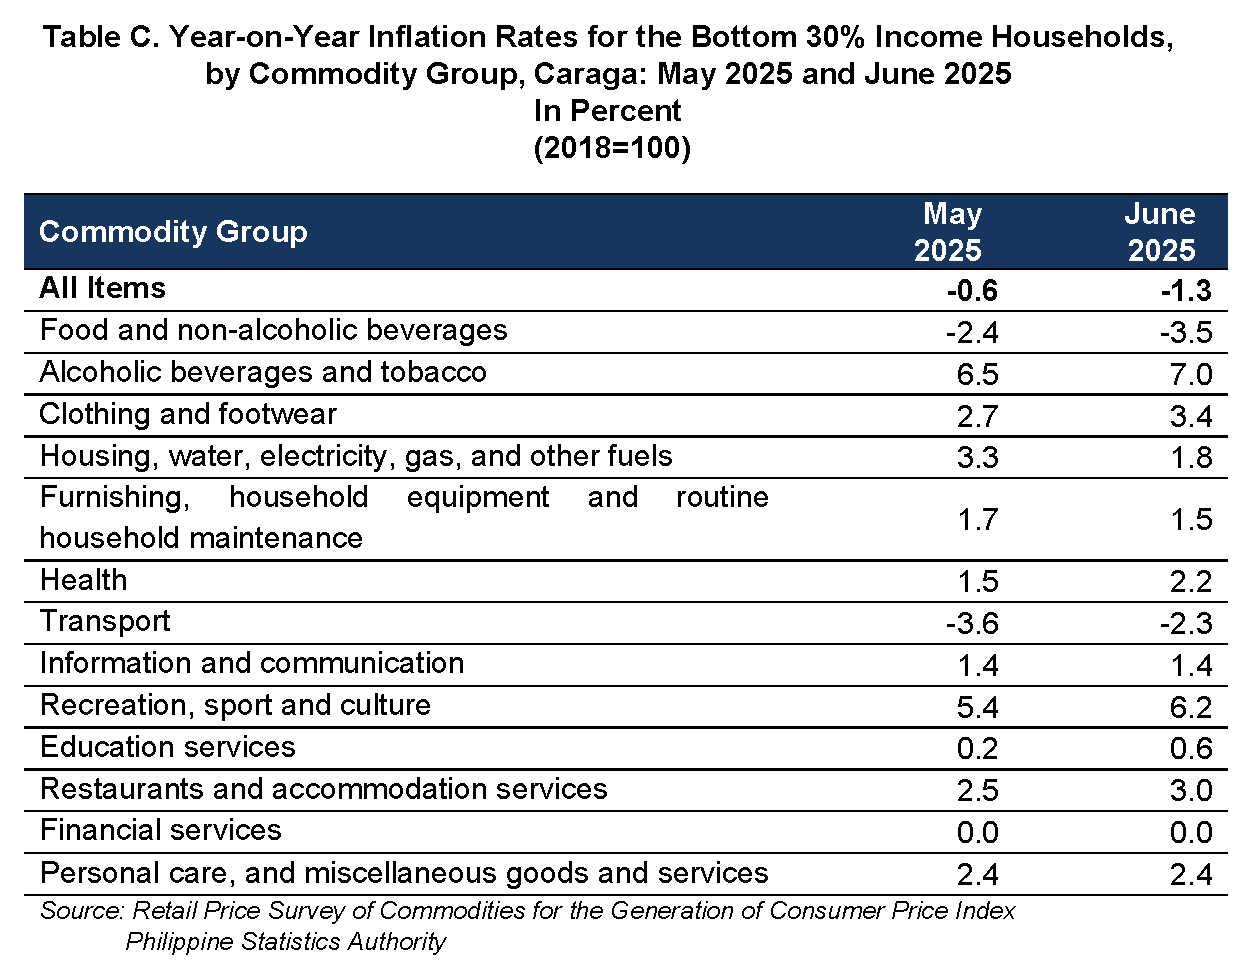
The primary driver of deflation was the pronounced decline in the year-on-year growth rate of prices in the Food and Non-Alcoholic Beverages group. Inflation in this category dropped further to -3.5 percent in June 2025, from -2.4 percent in the previous month. A key factor behind this trend was the significant reduction in rice prices, which posted an inflation rate of -19.1 percent, compared to -16.5 percent in May 2025. The Food and Non-Alcoholic Beverages group alone accounted for approximately 77.1 percent of the overall inflation decline for this income group.
Other Commodity Groups with declining inflation
A. Housing, Water, Electricity, Gas and other Fuels:
Inflation in the Housing, Water, Electricity, Gas and other Fuels group slowed to 1.8 percent in June 2025 from 3.3 percent in May 2025. This deceleration was primarily driven by lower year-on-year growth of electricity and LPG, which posted an inflation rate of 1.0 percent and 4.0 percent this month from 7.0 percent and 5.7 percent in the previous month.
B. Furnishings, Household Equipment and Routine Household Maintenance:
Inflation in this group also declined, registering at 1.5 percent in June 2025, down from 1.7 percent in May 2025.
On the contrary, the following commodity groups recorded increased inflation rates in June 2025:
1. Alcoholic Beverages and Tobacco, at 7.0 percent from 6.5 percent;
2. Clothing and Footwear, at 3.4 percent from 2.7 percent;
3. Health, at 2.2 percent from 1.5 percent;
4. Recreation, Sport and Culture, at 6.2 percent from 5.4 percent;
5. Education Services, at 0.6 percent from 0.2 percent; and
6. Restaurants and Accommodation Services, at 3.0 percent from 2.5 percent.
On the other hand, the Transport commodity group recorded a slower decrease in prices this June 2025, with an inflation rate of -2.3 percent, slightly higher compared to
-3.6 percent in May 2025.
Meanwhile, these commodity groups maintained their inflation rates from May 2025 to June 2025. This means that there were no change in the rate of price increases for these groups over the two consecutive months. These commodity groups are the following:
1. Information and communication, at 1.4 percent;
2. Financial Services, at 0.0 percent; and
3. Personal care, and miscellaneous goods and services, at 2.4 percent.
B. Food Inflation
Food Inflation for Bottom 30% Income Households Further Decline to –4.2 Percent in June 2025
At the regional level, food inflation for the bottom 30% income households continued to decline, reaching -4.2 percent in June 2025, down from -2.9 percent in May 2025. This marks a significant drop compared to 8.5 percent recorded in June 2024 (see Table D).
The main driver of this downward trend was the continued decrease in prices of Cereals and Cereals Products, which posted an inflation rate of -15.4 percent in June, from -13.5 percent in May 2025. This decline was largely due to lower rice prices, with rice inflation falling further to -19.1 percent from -16.5 percent in the previous month. Additionally, corn prices also decreased, registering an inflation rate of -9.9 percent in June, from -9.2 percent in May. This food group alone accounted for approximately 60.6 percent of the overall downtrend in food inflation.
Other Food groups with lower inflation in June 2025:
A. Fish and other seafood: Decreased to 2.2 percent from 5.1 percent;
B. Sugar, confectionery and desserts: down to 2.9 percent from 3.1 percent; and
C. Ready-made food and other food products n.e.c.: Dropped to -0.5 percent from 2.3 percent.
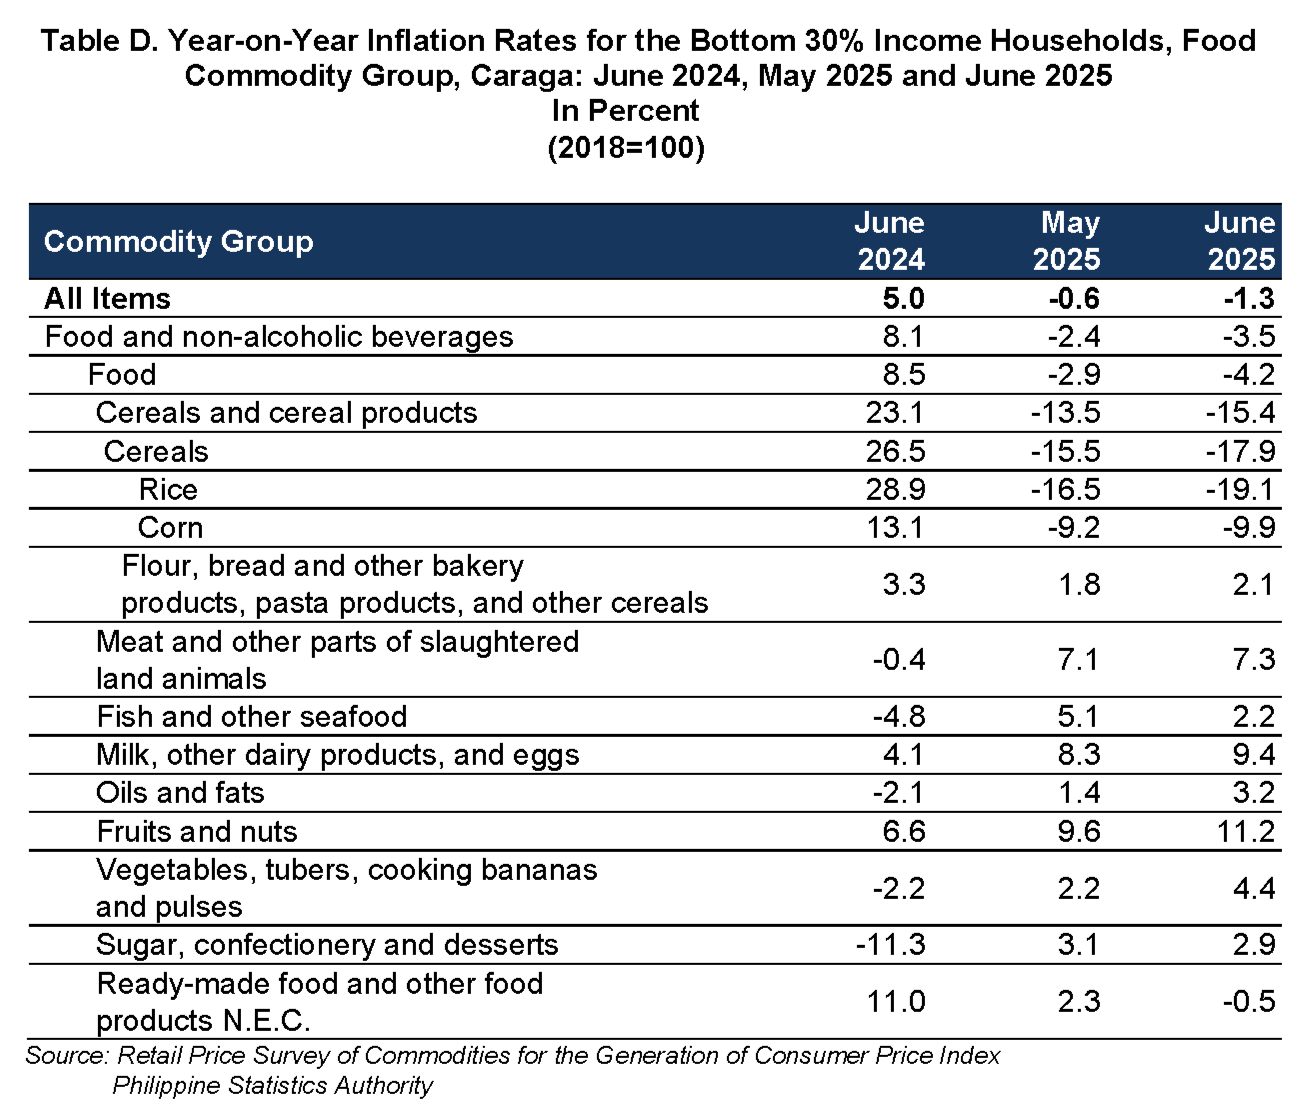
Food groups with higher inflation in June 2025:
The following food groups recorded higher inflation rates in June 2025 compared to the previous month:
A. Flour, Bread and Other Bakery Products, Pasta Products, and Other Cereals –
increased to 2.1 percent, from 1.8 percent;
B. Meat and Other Parts of Slaughtered Land Animals – rose to 7.3 percent, from 7.1 percent;
C. Milk, Other Dairy Products, and Eggs – increased to 9.4 percent, from 8.3 percent;
D. Oils and Fats – climbed to 3.2 percent, from 1.4 percent;
E. Fruits and Nuts – rose to 11.2 percent, from 9.6 percent; and
F. Vegetables, Tubers, Plantains, Cooking Bananas, and Pulses – increased to 4.4 percent, from 2.2 percent.
C. Provinces and Highly Urbanized City (HUC)
Inflation rates across Caraga's provinces and Highly Urbanized City – Butuan City in June 2025 showed mixed movements, indicating varying price dynamics across the region. (Refer to Table A).
Provinces with Declining Inflation (Further Deflation):
• Agusan del Norte saw a decline in inflation from -0.2 percent in May to -2.1 percent in June, indicating faster deflation and a sharper drop in prices.
• Surigao del Norte and Surigao del Sur also posted similar trends, with inflation decreasing from -0.5 percent to -1.8 percent and from -1.5 percent to -2.7 percent, respectively. This suggest that prices are falling at a faster rate in both provinces.
Rising Inflation:
• Butuan City, the region’s only HUC, experienced a rise in inflation from 1.8 percent in May to 2.2 percent in June, pointing to increased upward pressure on prices.
• Dinagat Islands also recorded a notable change, with inflation moving from -3.3 percent to -2.6 percent. While still in deflation territory, the easing rate of price decline suggests a softening of downward price pressures.
Unchanged Inflation:
• Agusan del Sur maintained its inflation rate at 0.7 percent for both May and June 2025, showing price stability in the province with no month-to-month change.
Most provinces in Caraga remain under deflation, though the pace of deflation has generally slowed, indicating early signs of price stabilization in the region.
Note:
CPIs and inflation rates by province and selected city are posted on the PSA website (http://openstat.psa.gov.ph/).
(Sgd.) GUILLERMO M. LIPIO, JR.
(Chief Statistical Specialist) Officer-In-Charge
PSA RSSO XIII
| Attachment | Size |
|---|---|
|
|
462.65 KB |