
Release Date :
Reference Number :
SR-2024-08-0050
Summary Inflation Report Consumer Price Index for All Income Households, All Items In Percent July 2024 (2018=100)
Headline Inflation
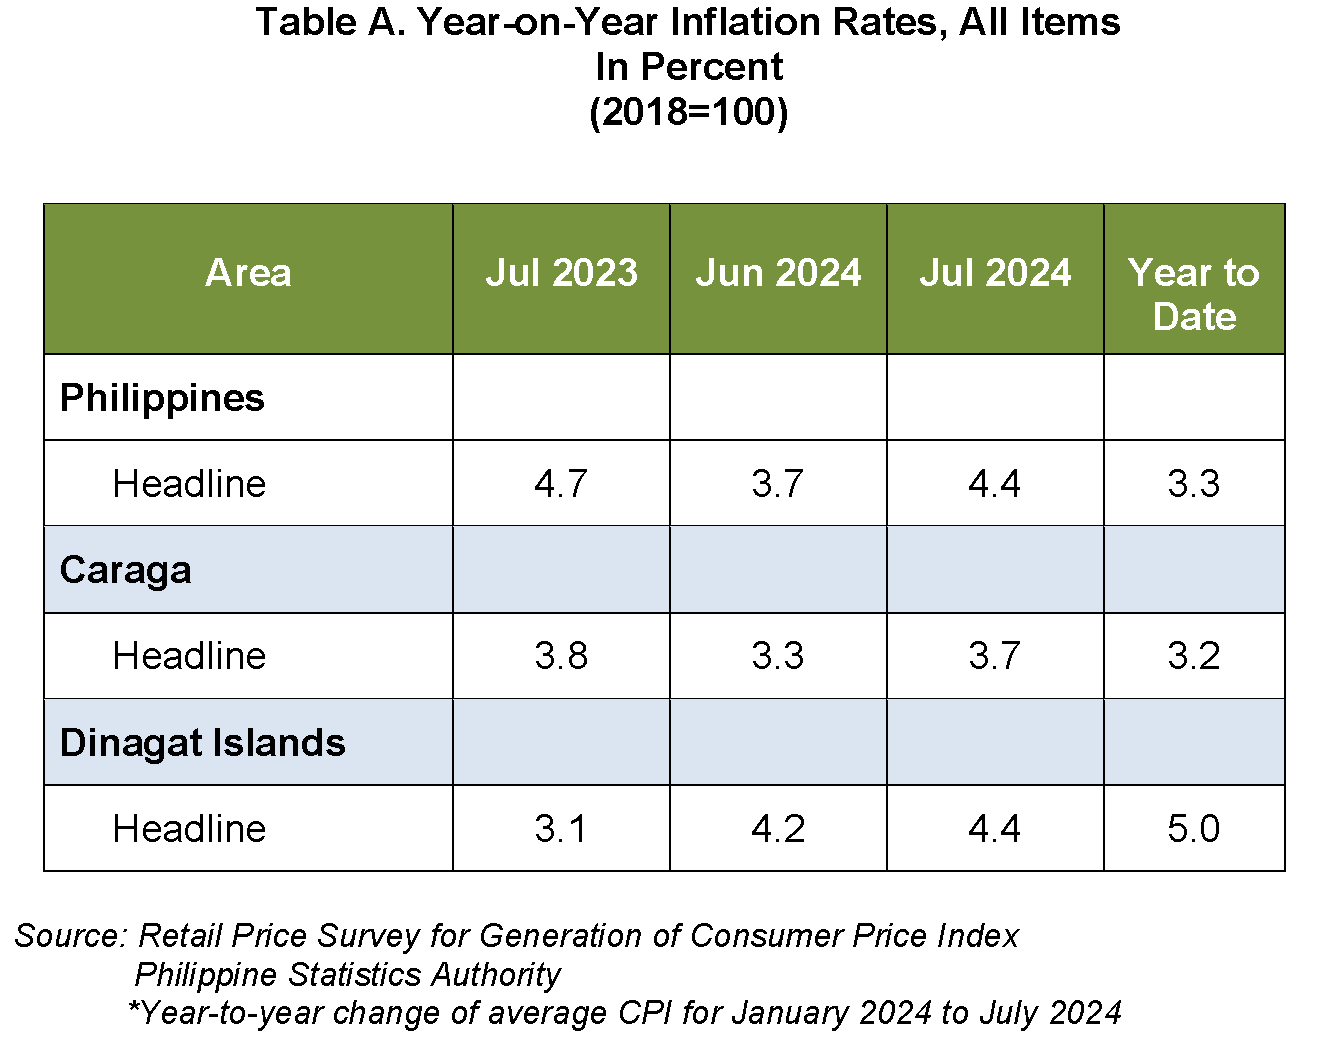
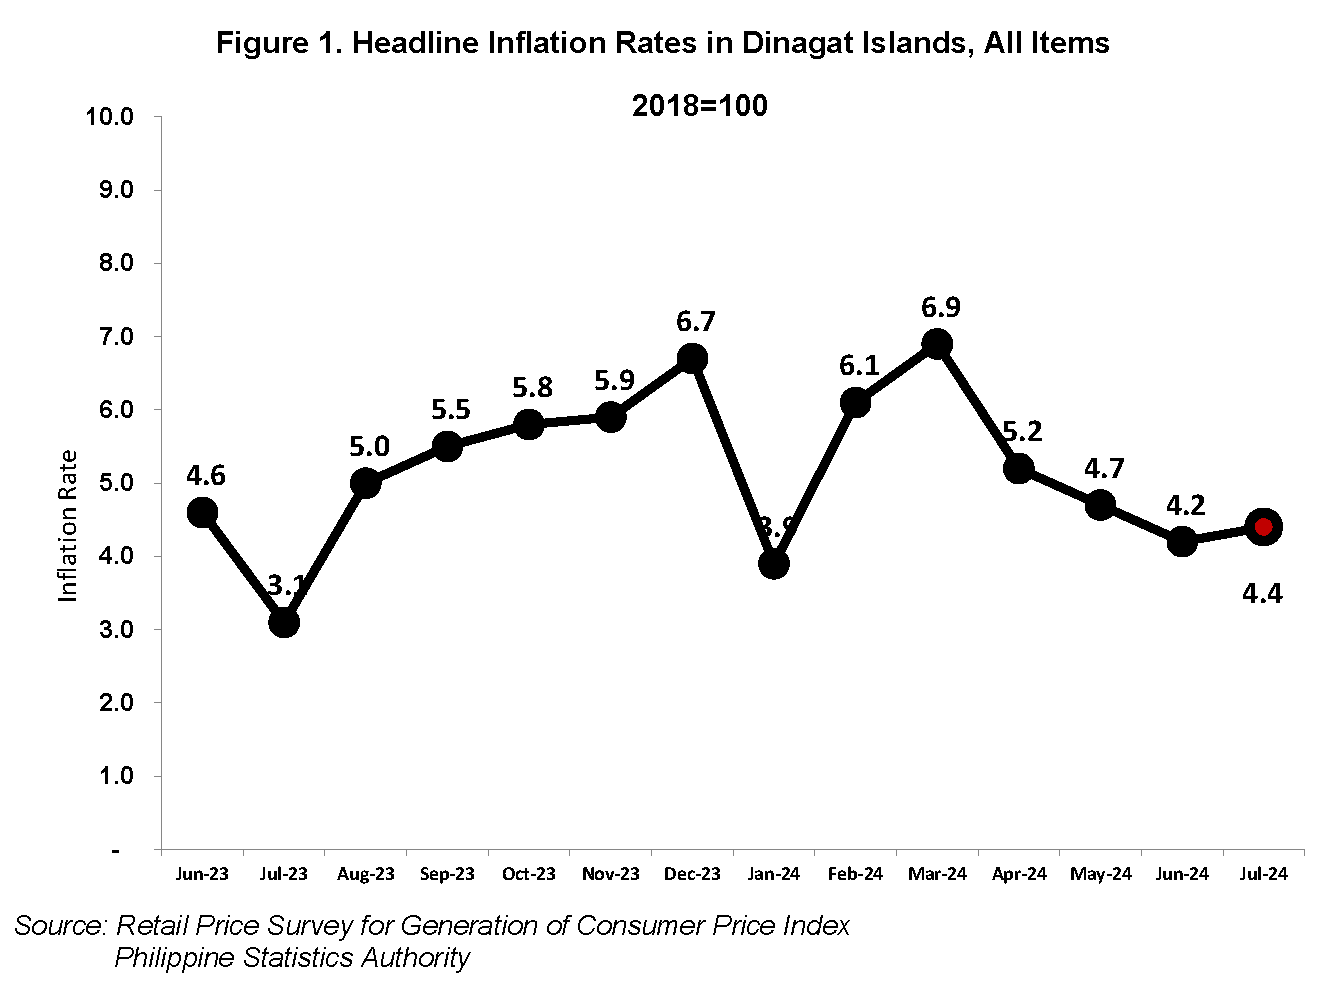
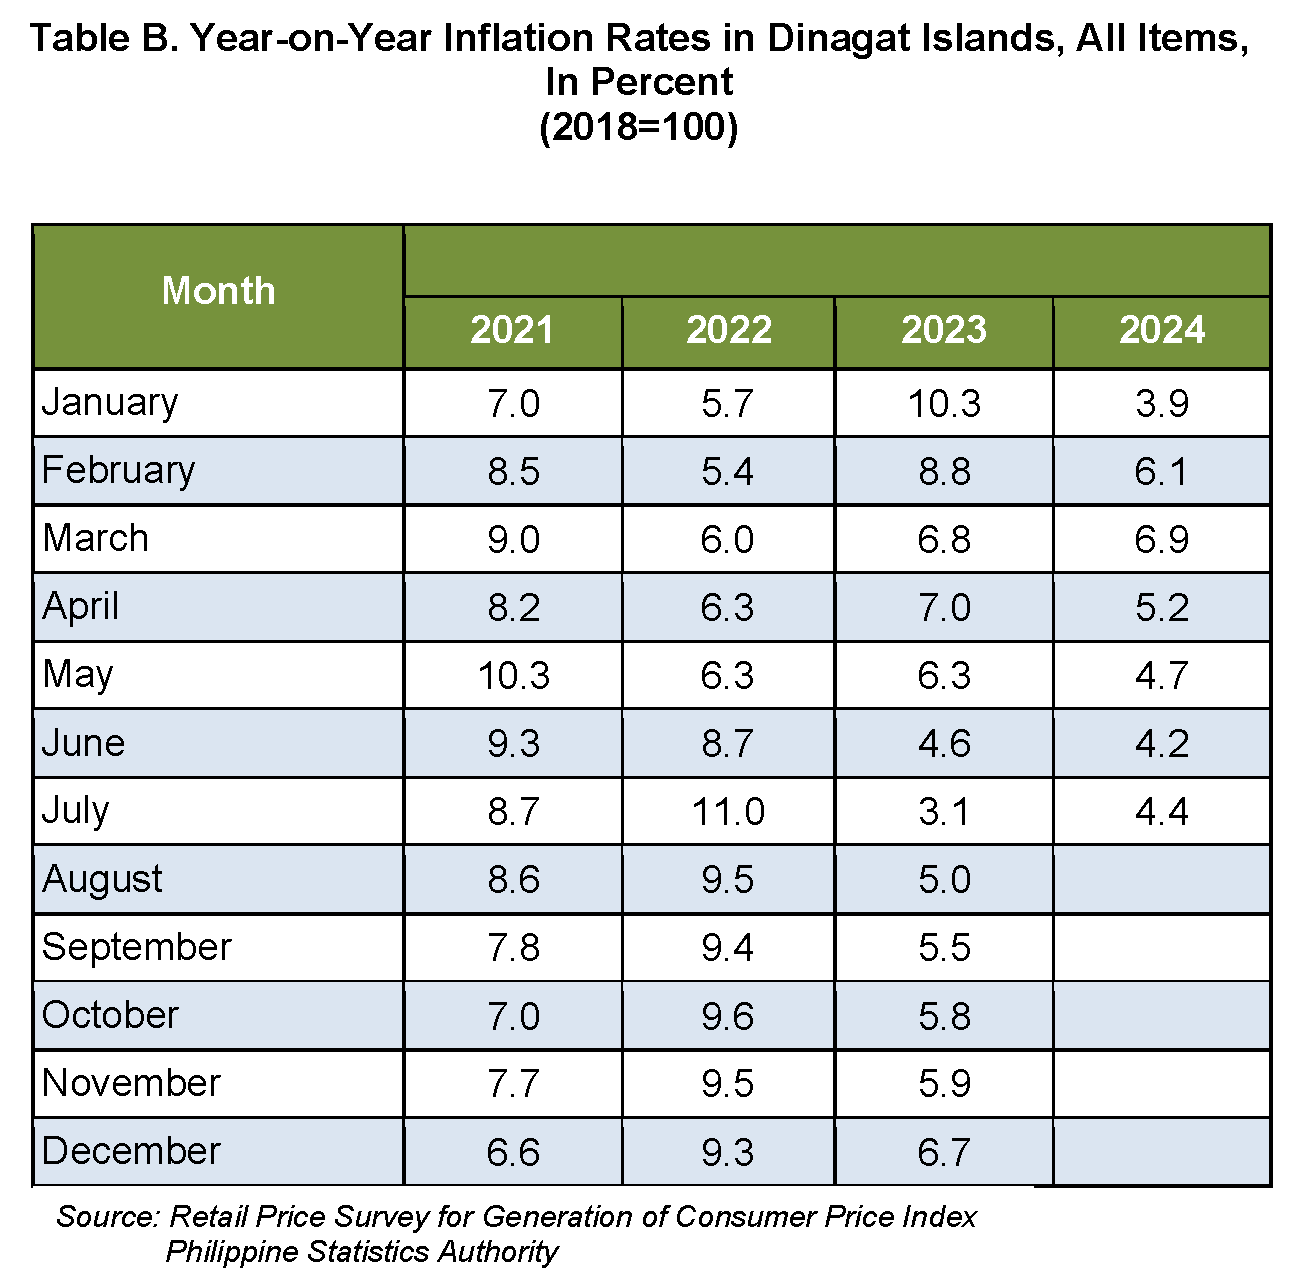
In July 2024, the headline inflation rate in the Province of Dinagat Islands rose to 4.4 percent, up from 4.2 percent in June 2024, reflecting a 0.2 percentage point increase. This also marks a significant rise of 1.3 percentage points from the 3.1 percent rate recorded in July 2023. The year-to-date inflation rate averages at 5.0 percent, surpassing both the national and regional averages of 3.3 percent and 3.2 percent, respectively (refer to Table A and Figure 1).
Main Drivers to the Downward Trend in Overall Inflation
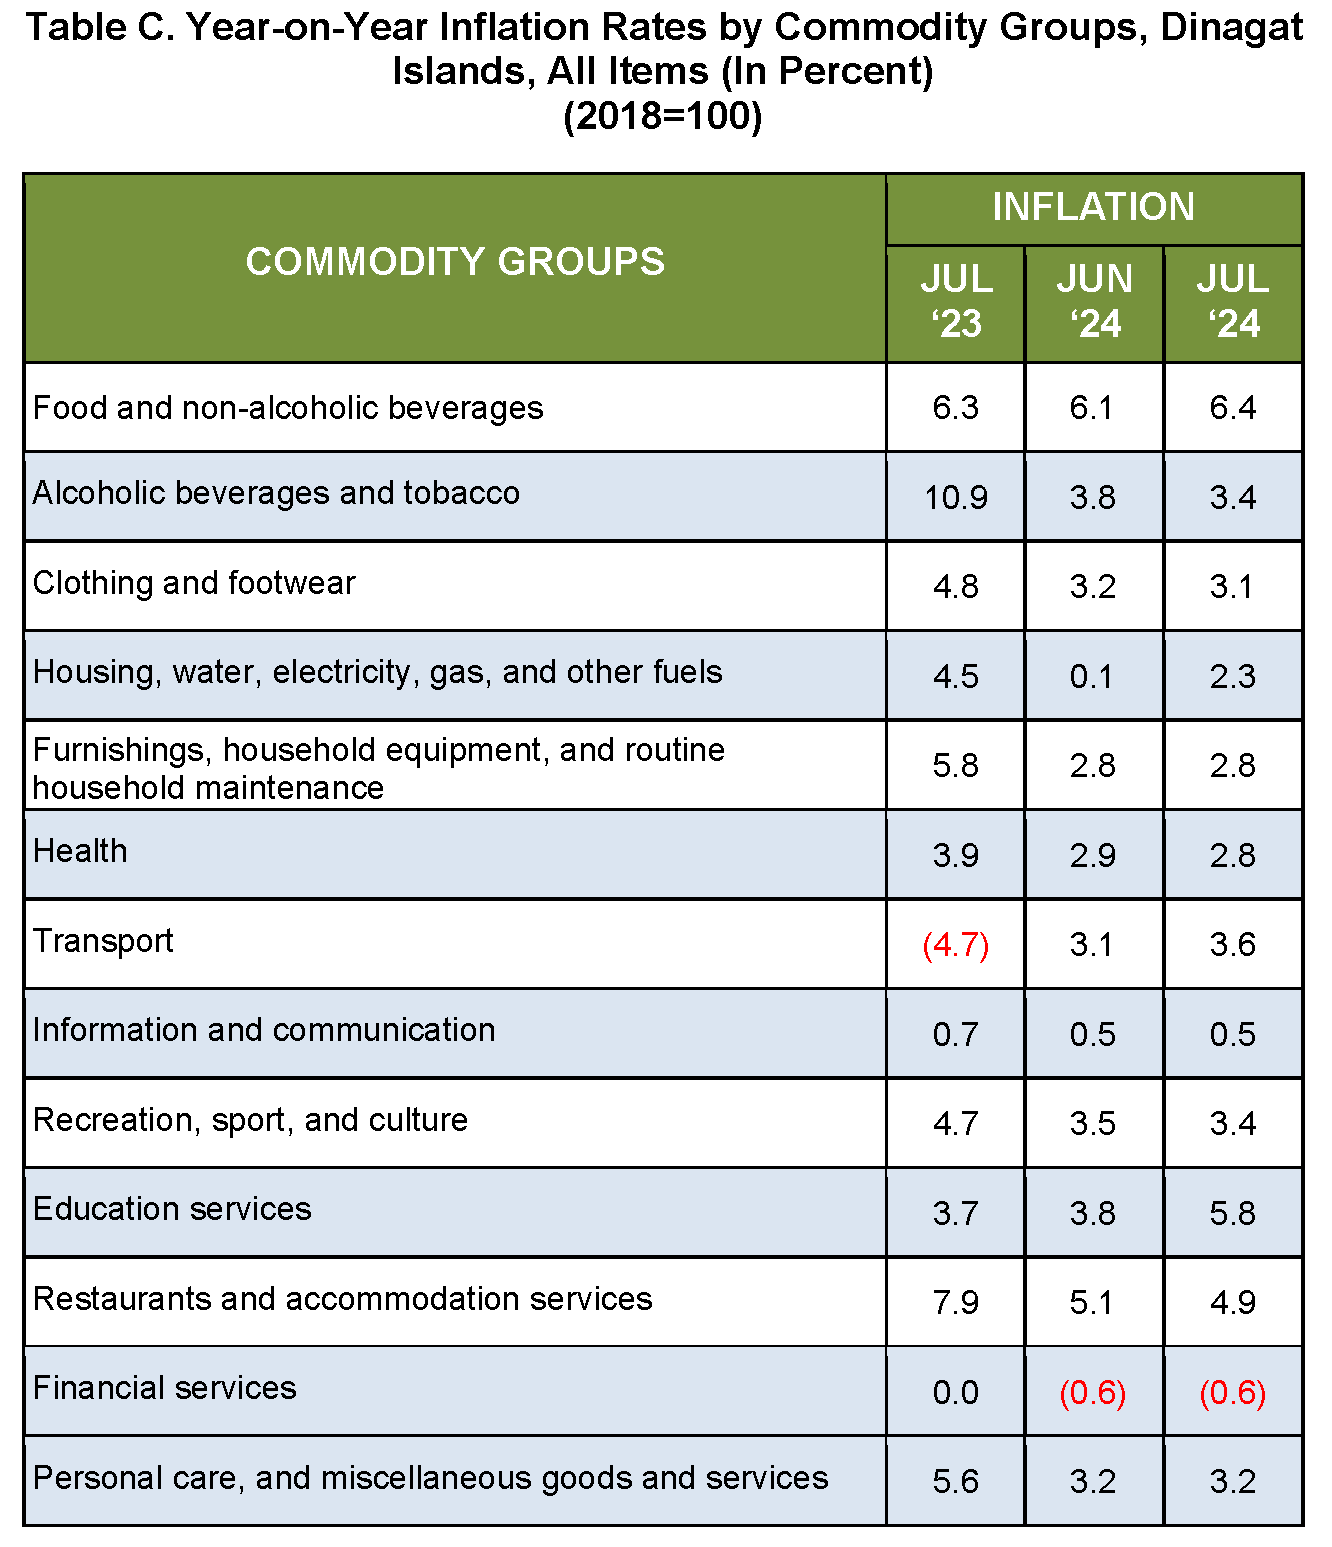
The rise in July 2024's inflation rate is mainly attributed to the Food and Non-alcoholic Beverages group, which recorded a 6.3 percent inflation rate, contributing approximately 75.0 percent to the overall provincial inflation increase. The Transport group also presented a moderate increase in average price indices, leading to a 2.9 percent inflation rate, up from 1.8 percent in the previous month, contributing around 21.6 percent to the overall trend. This was primarily influenced by the rapid increase in fuel and lubricant prices.
Additionally, the Recreation, Sports, and Culture group showed a faster rise in average price indices, particularly driven by a surge in the prices of stationery and drawing materials, with an inflation rate of 2.8 percent compared to 2.2 percent in June 2024, contributing approximately 1.7 percent to the overall provincial inflation rate (refer to Tables B and C).
Other commodity groups experiencing an upsurge in average price indices included:
• Restaurants and Accommodation Services: Increased to 2.9 percent from 2.7 percent in June 2024.
Conversely, the following commodity groups saw rapid decreases in price indices this month:
• Alcoholic Beverages and Tobacco: Registered an inflation rate of 5.1 percent, down from 5.4 percent in June 2024.
• Clothing and Footwear: Inflation rate of 2.7 percent, down from 3.6 percent in June 2024.
• Housing, Water, Electricity, Gas, and Other Fuels: Noted an inflation rate of 2.5 percent, down from 3.0 percent in the previous month.
• Furnishings, Household Equipment, and Routine Household Maintenance: Rate of 3.9 percent, down from 4.2 percent.
• Personal Care and Miscellaneous Goods and Services: Inflation rate of 2.3 percent, down from 2.8 percent in the previous month.
Top Contributors to the Overall Provincial Inflation Rate
The following commodity groups were the top three contributors to the July 2024 overall inflation for all income households.
• Food and Non-alcoholic beverages, 55.5 percent share or 2.44 percentage points.
• Housing, water, electricity, gas, and other fuels, 11.3 percent share or 0.50 percentage points; and
• Restaurants and Accommodation Services, 10.8 percent share or 0.48 percentage points.
Food Index
The food index for July 2024 also saw a faster rise in average prices, increasing to 6.5 percent from 6.1 percent in June 2024.
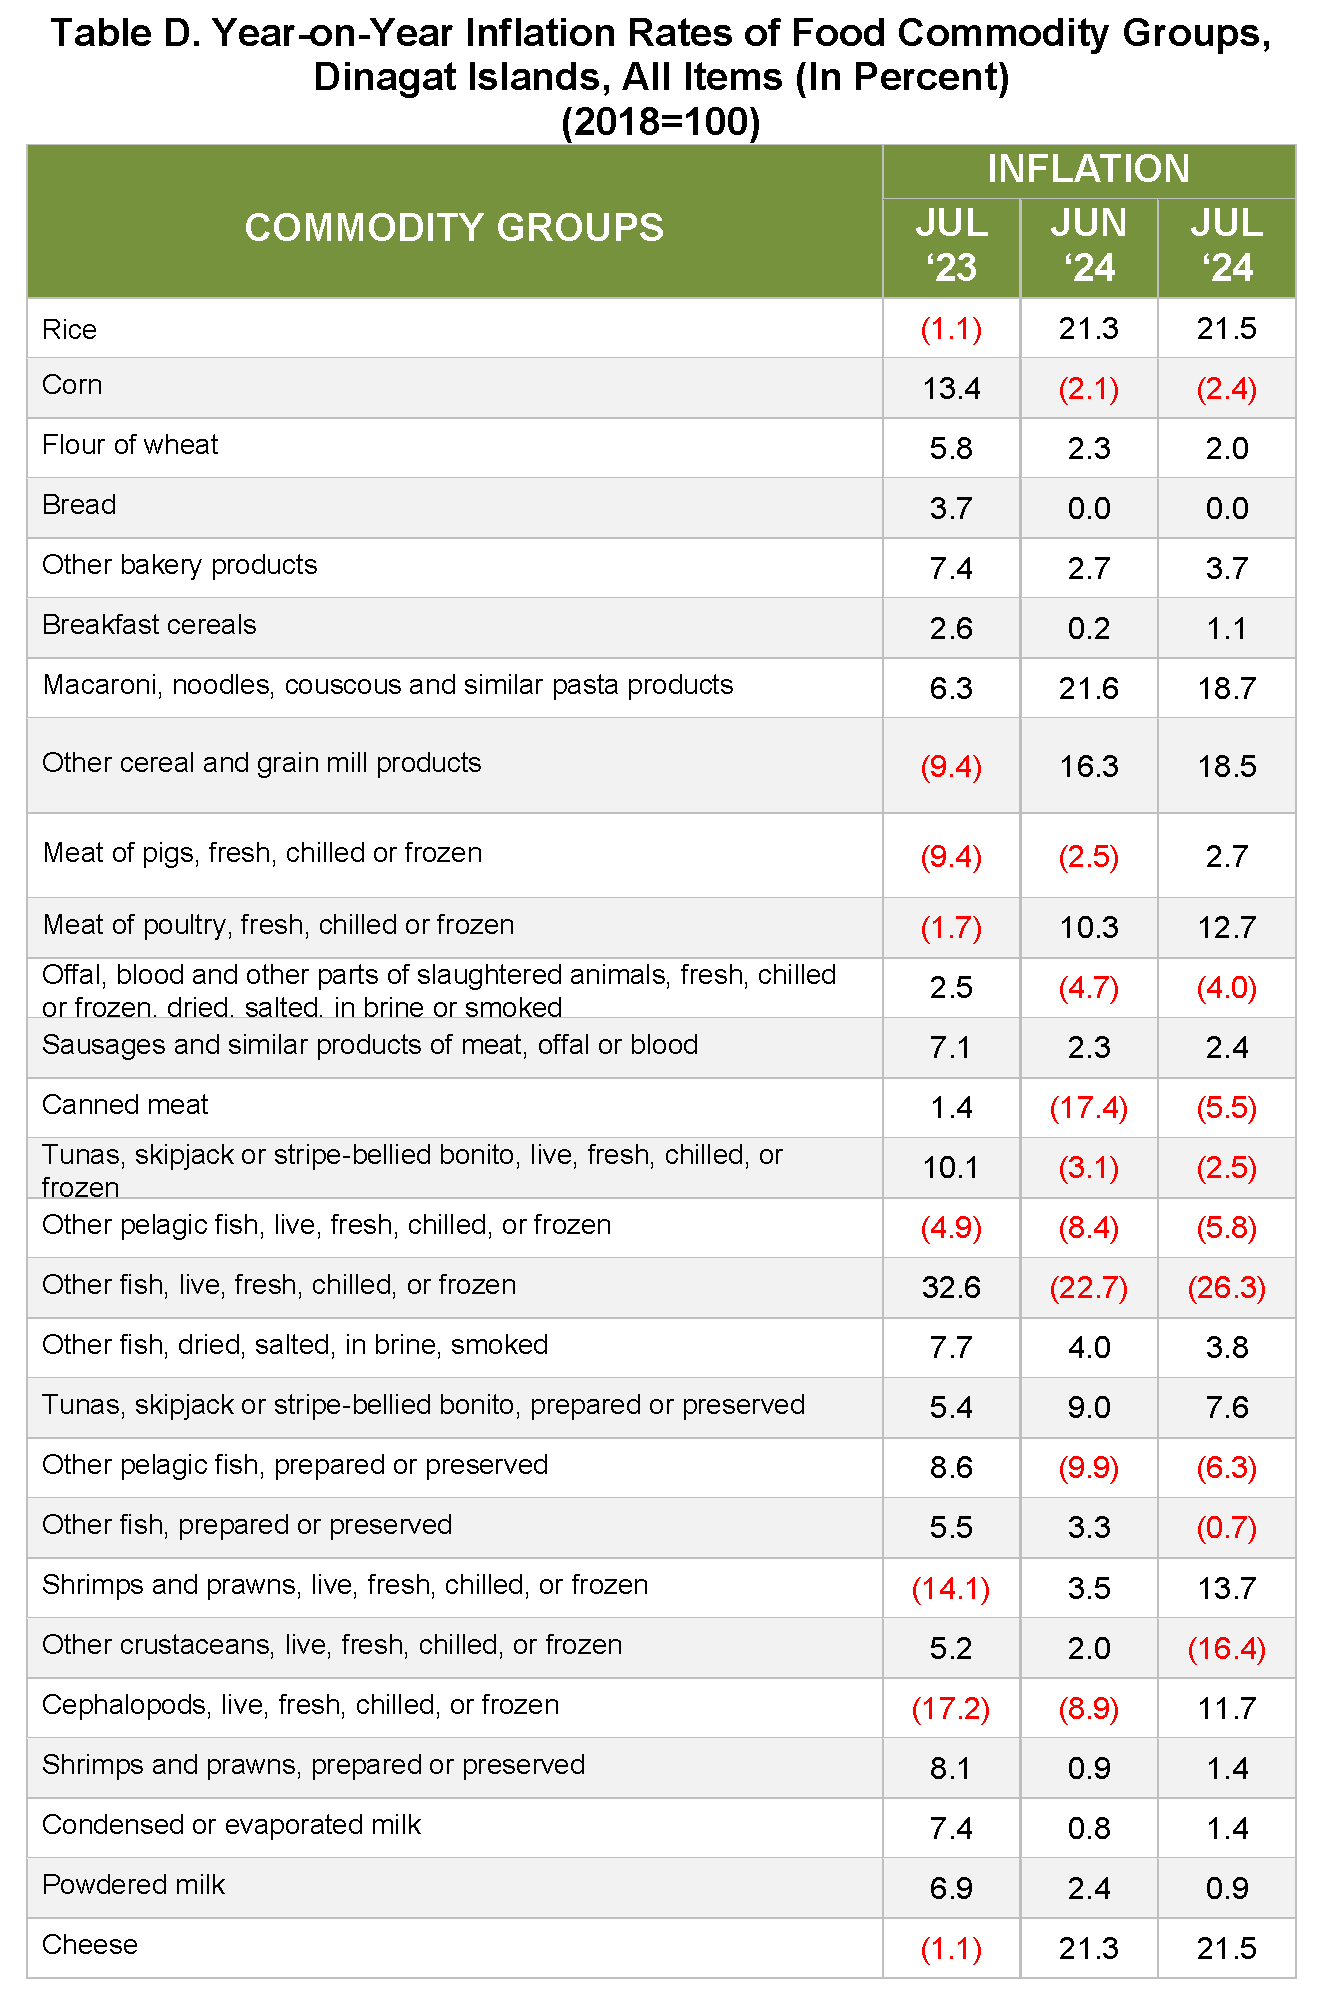
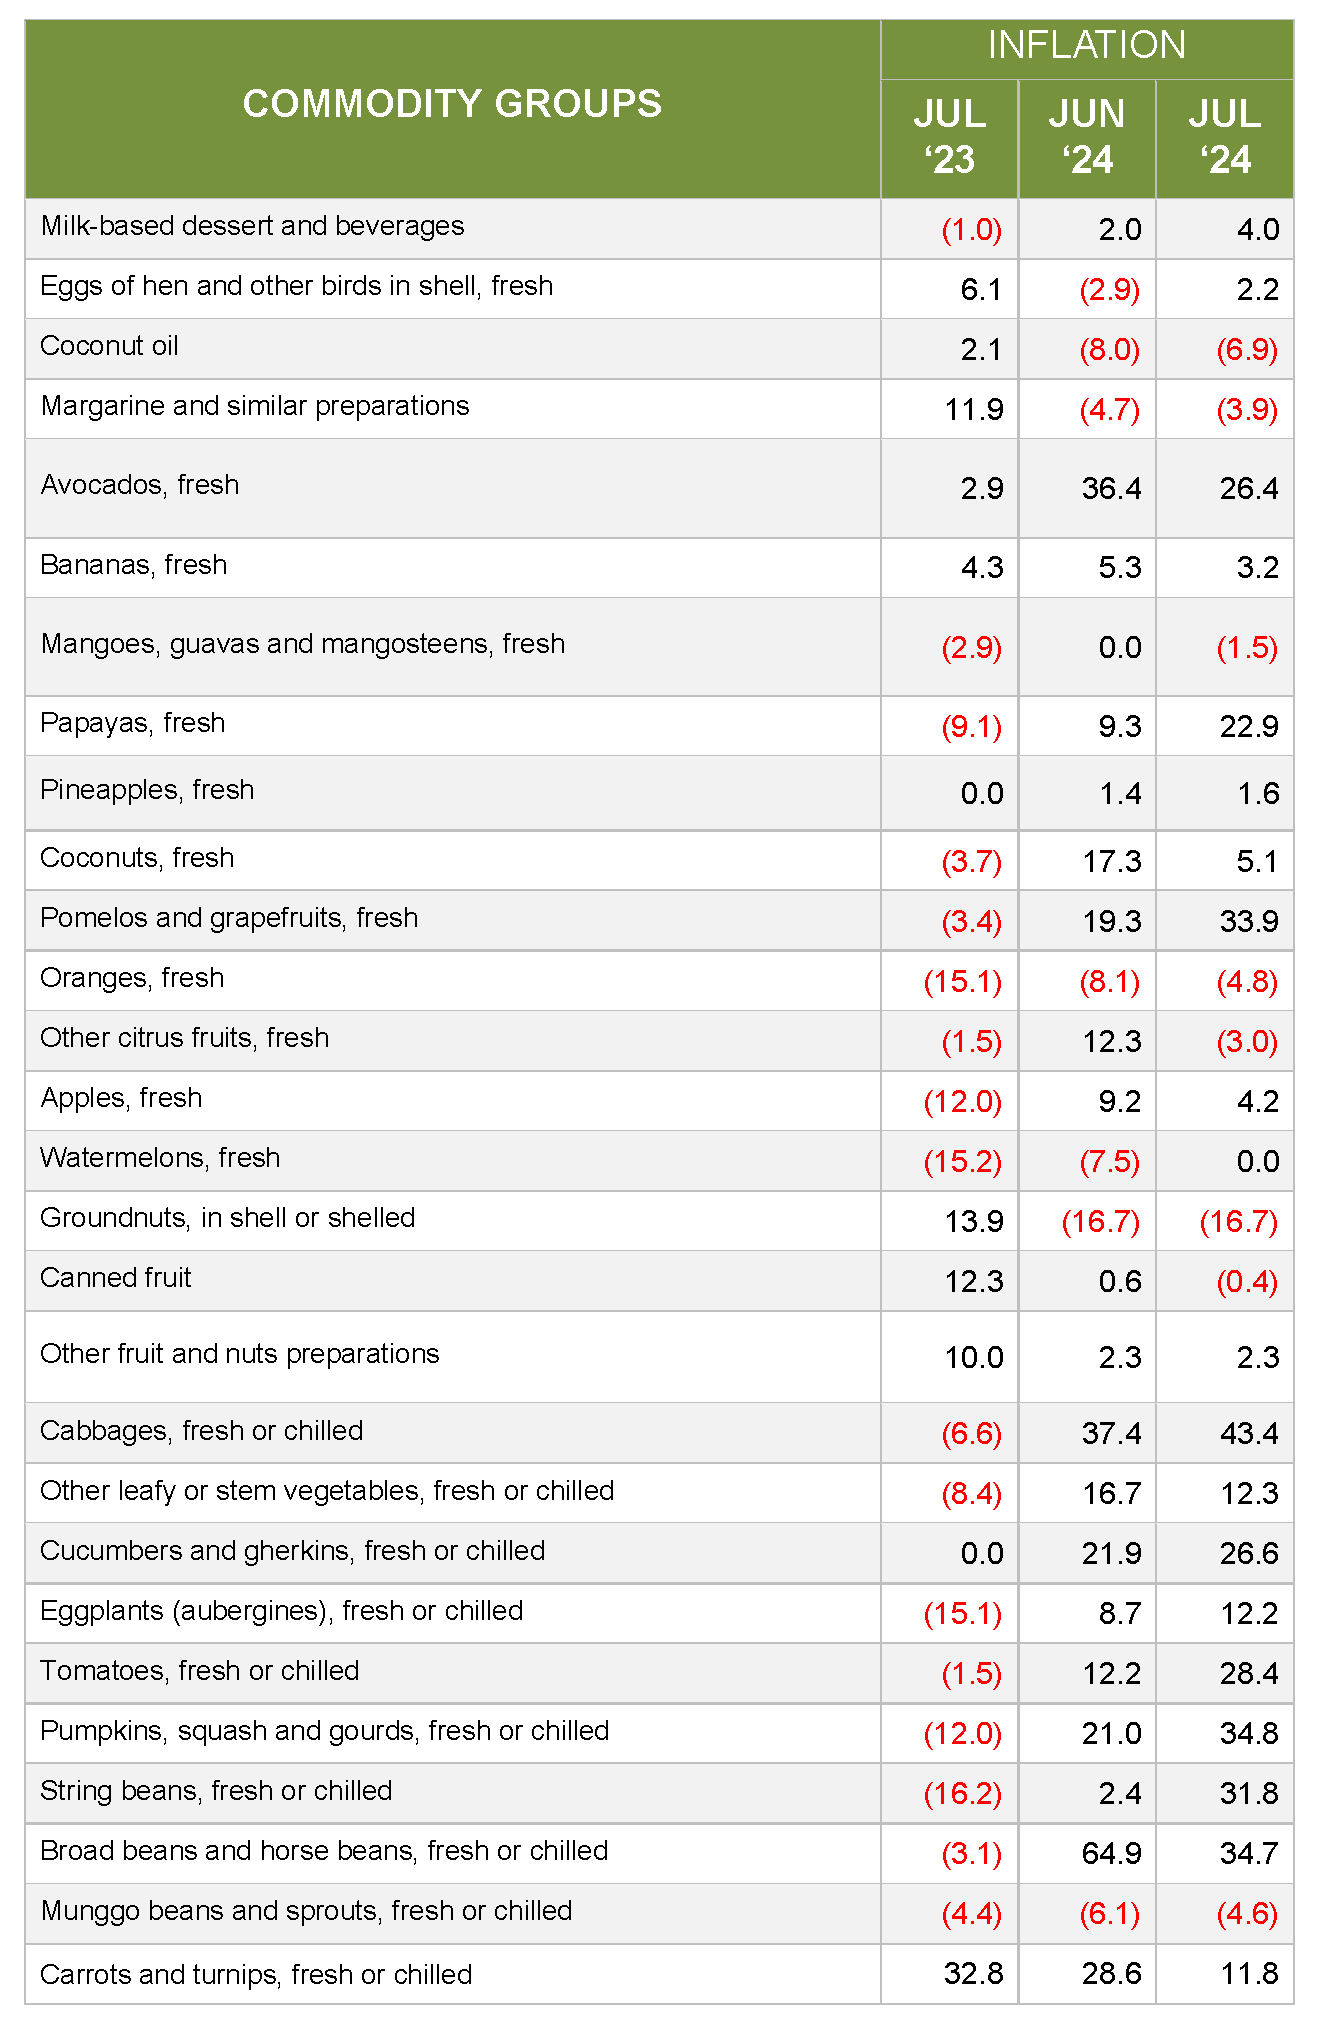
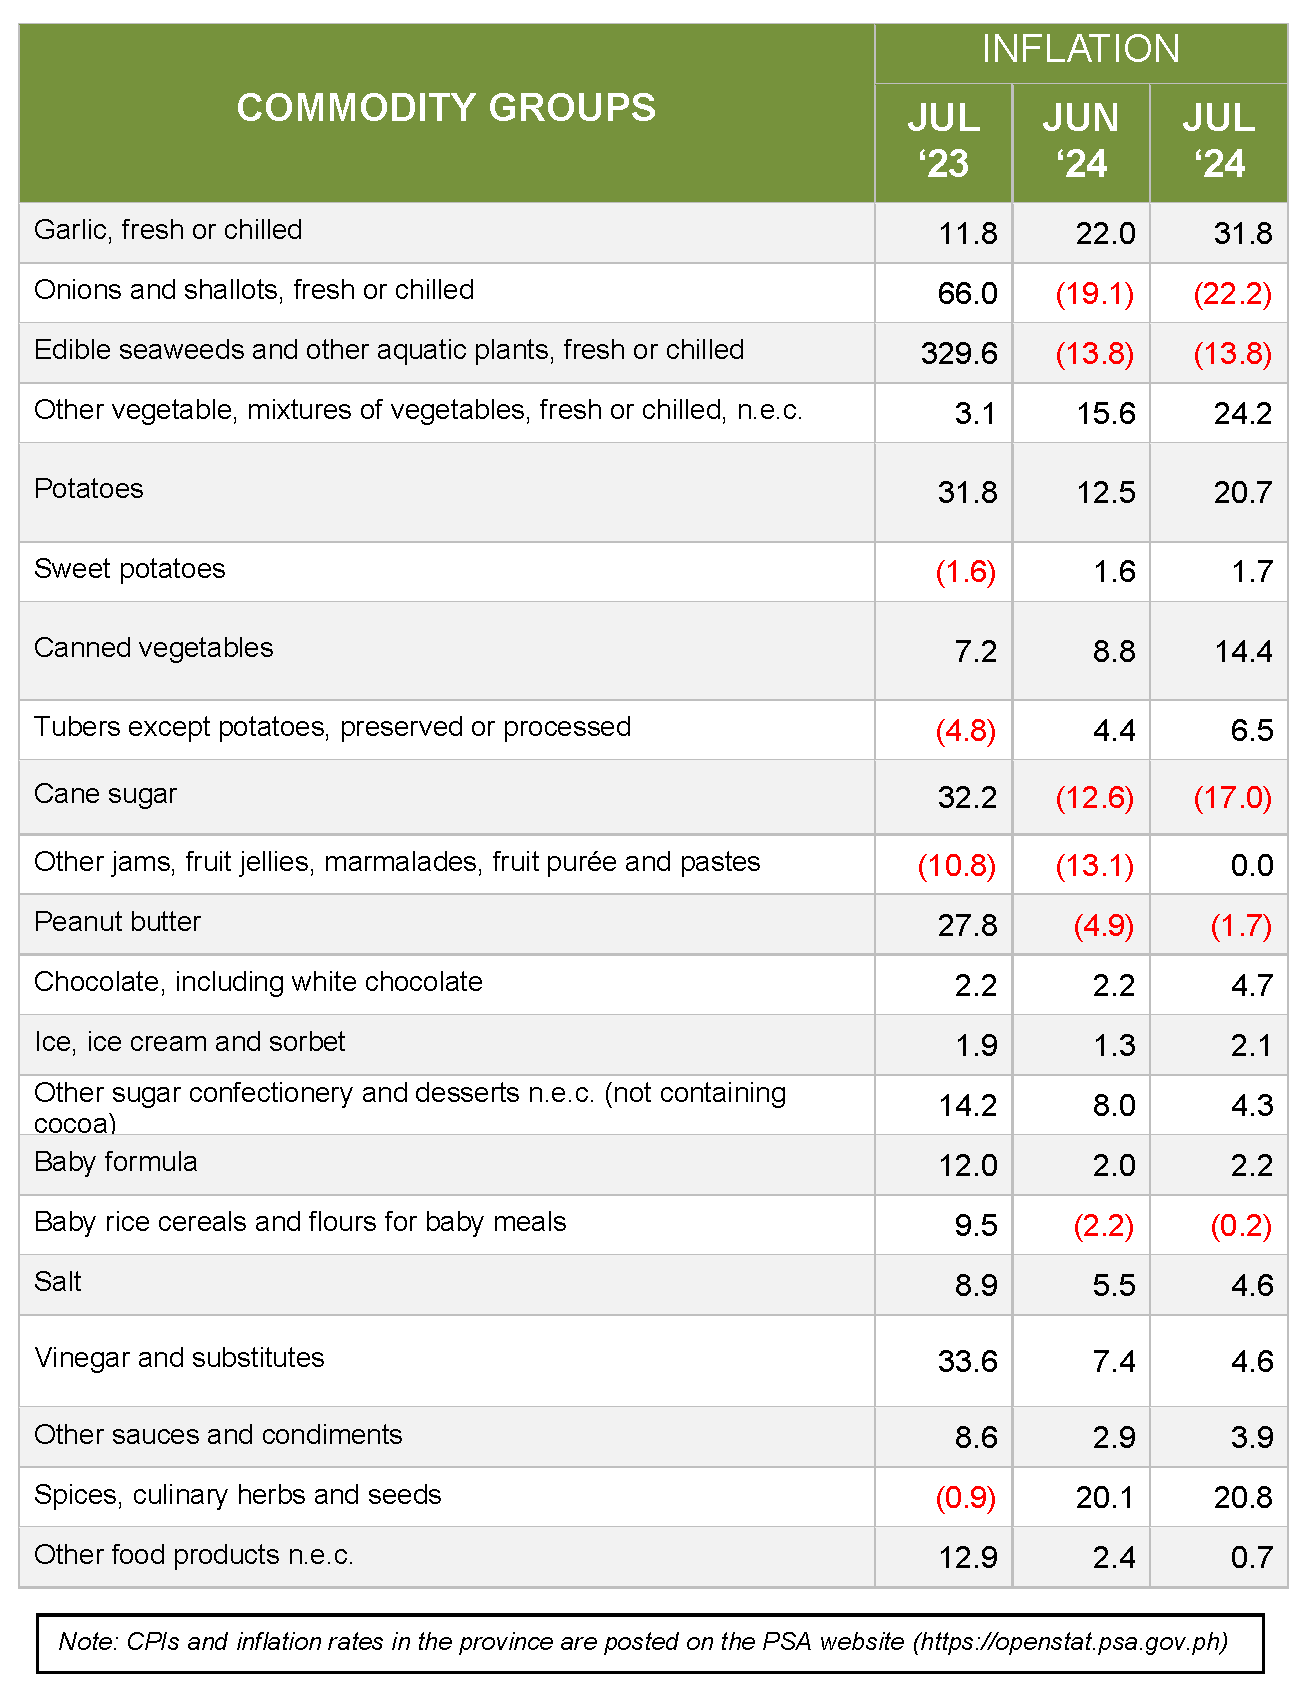
The main drivers for the rising food index compared to the preceding month include (see Table D):
1. Meat and Other Parts of Slaughtered Land Animals: Particularly fresh, chilled, or frozen meat with an inflation rate of 7.1 percent, up from 4.7 percent in the previous month, contributing about 23.0 percent to the food inflation trend.
2. Vegetables, Tubers, Plantains, Cooking Bananas, and Pulses: Noted an inflation rate of 12.4 percent, up from 9.9 percent in the previous month, contributing approximately 20.1 percent to the food inflation trend.
3. Cereals and Cereal Products (particularly rice): Recorded an inflation rate of 18.0 percent, up from 17.6 percent in the previous month, contributing about 19.4 percent to the food inflation trend.
4. Milk and Other Dairy Products and Eggs: Inflation rate of 1.7 percent, up from -0.4 percent in the previous month, contributing approximately 17.7 percent to the overall trend.
5. Fish and Other Seafood: Registered an inflation rate of -5.8 percent, up from -6.6 percent in the previous month, contributing about 17.6 percent to the overall uptrend.
Purchasing Power of Peso
The Purchasing Power of the Peso (PPP) for the Province of Dinagat Islands was pegged at Php 0.73 since in April 2024.
(Sgd.) VILLUZ C. OROZCO
Officer-in-Charge
Supervising Statistical Specialist
Technical Notes
The Philippine Statistics Authority generates the monthly Consumer Price Index (CPI) based on the nationwide survey of prices for a given basket of goods and services. Two important indicators, the inflation rate and purchasing power of the peso (PPP) are derived from the CPI which is important in monitoring price stability and the value of the country’s currency.
The Consumer Price Index (CPI) is an indicator of the change in the average retail prices of a fixed basket of goods and services commonly purchased by households relative to a base year. It shows how much on the average, prices of goods and services have increased or decreased from a particular reference period known as base year.
The CPI is mostly used in the calculation of the rate and purchasing power of the peso. It is a major statistical series used for economic analysis and as monitoring indicator of government economic policy.
The CPI is also used to adjust other economic series for price changes. Another major importance of the CPI is its use as basis to adjust wages in labor management contracts as well as pensions and retirement benefits.
Inflation rate refers to the rate of change in the average prices of goods and services typically purchased by consumers. It is interpreted in terms of declining purchasing power of money.
The Purchasing Power of the Peso (PPP) indicates the value of the peso in the period under review as compared to the value of the peso in the base period. It is computed as the reciprocal of the CPI for the period under review multiplied by 100.
| Attachment | Size |
|---|---|
|
|
359.03 KB |