

Release Date :
Reference Number :
WPR-2025-348
Headline Inflation
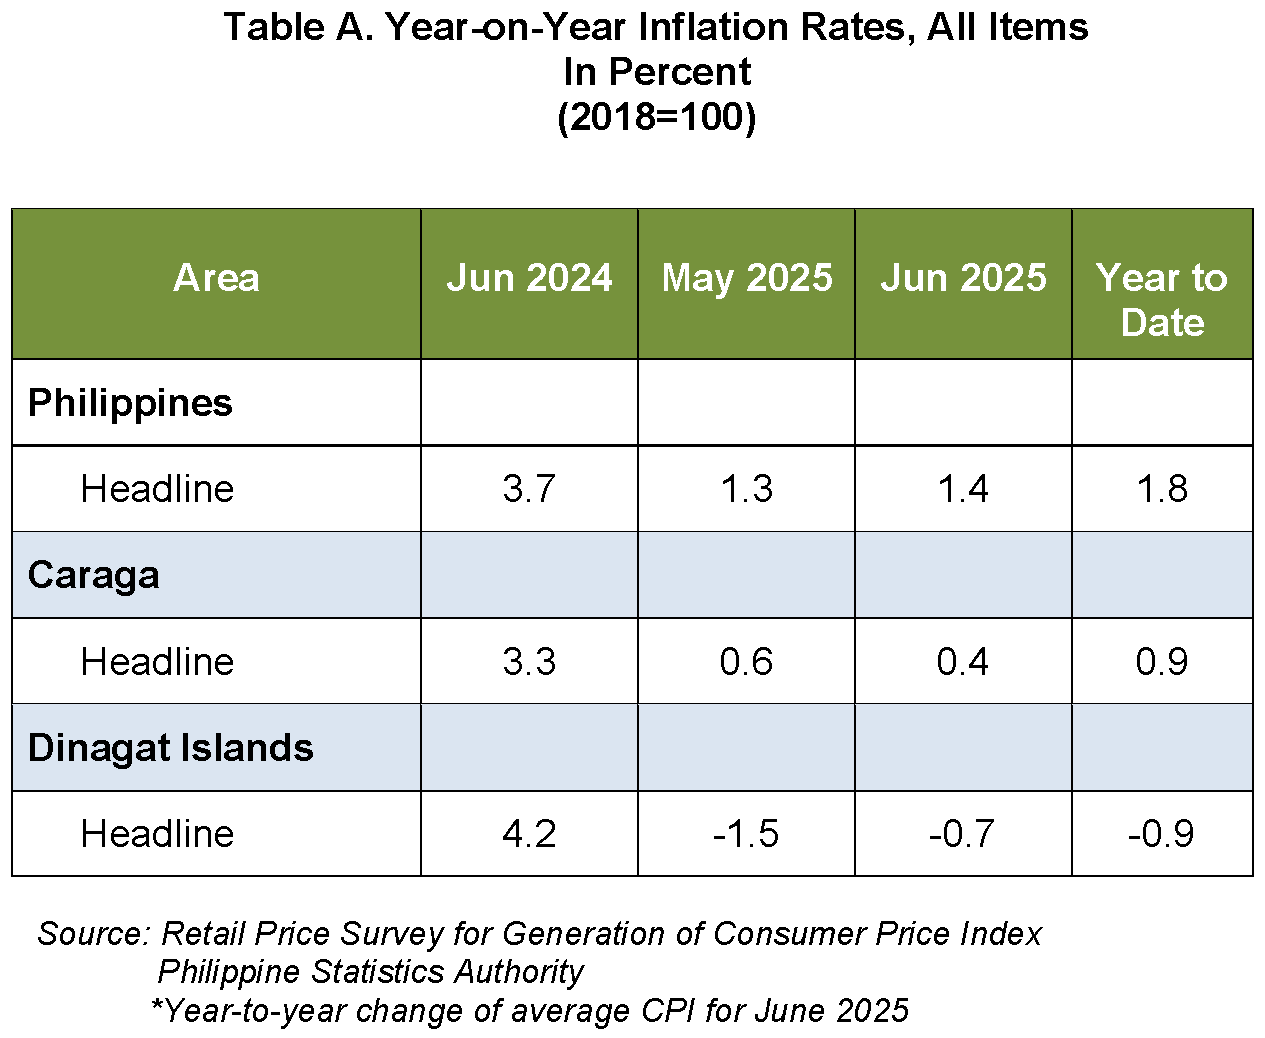
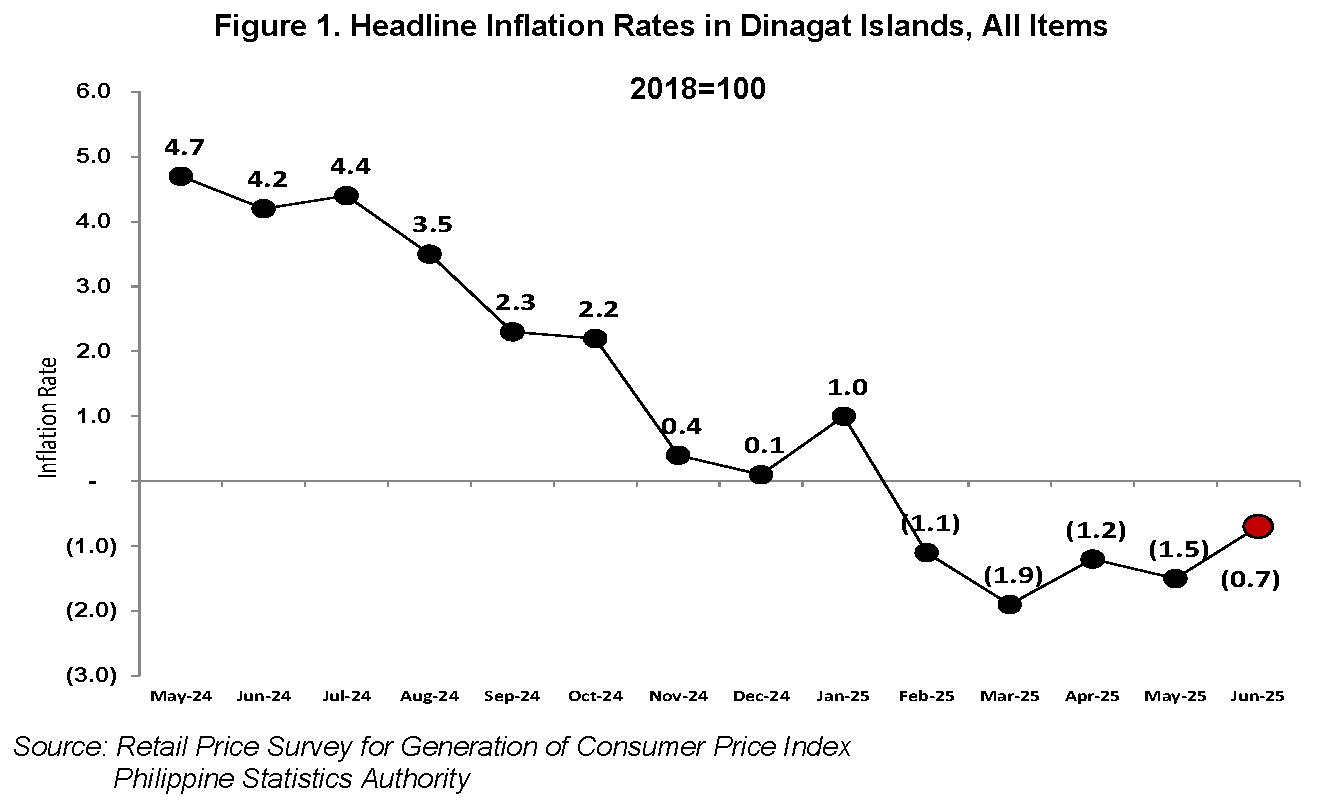
The headline inflation rate in the Province of Dinagat Islands rose to -0.7 percent in June 2025, up from -1.5 percent in May 2025. This marks a 0.8 percentage point increase from the previous month, and a 4.9 percentage point decline compared to June 2024. The year-to-date average inflation rate now stands at -0.9 percent, significantly lower than the national average of 1.8 percent and the Caraga regional average of 0.9 percent (refer to Table A and Figure 1).
Key Drivers of Inflation Gain to -0.7 Percent
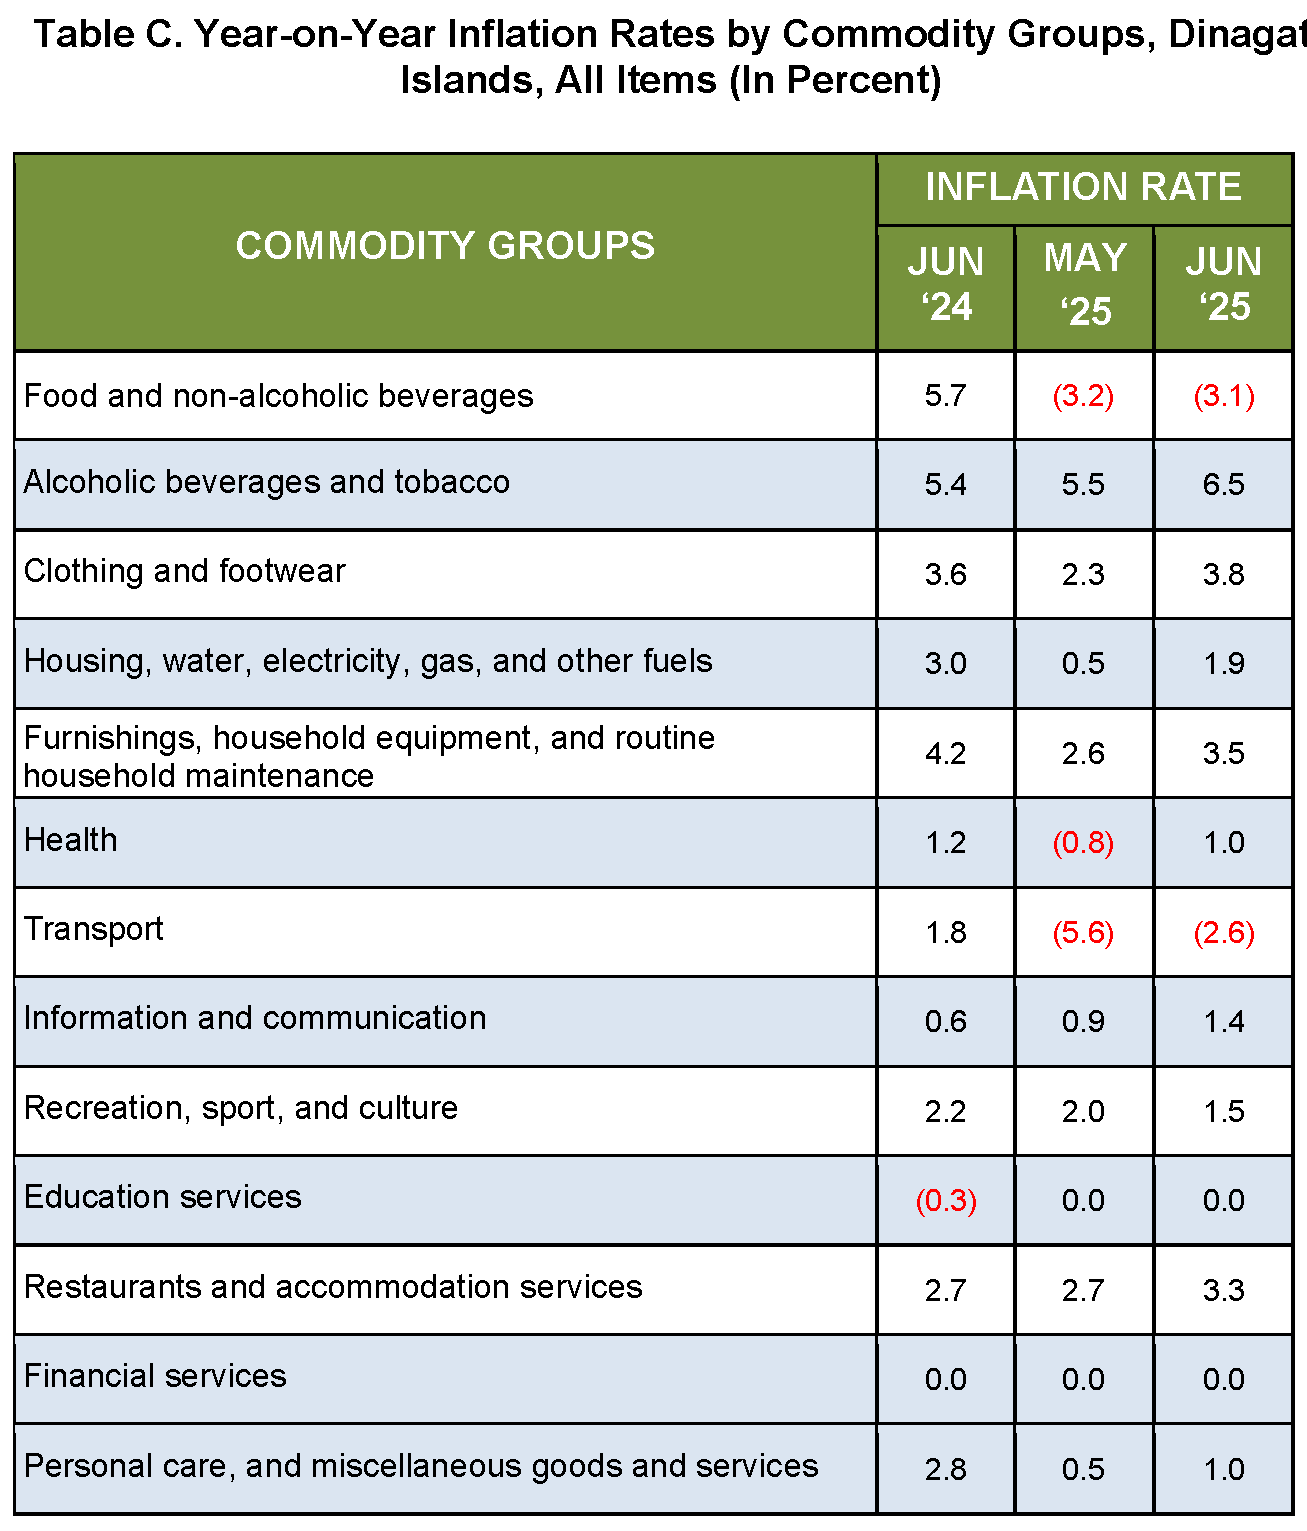
The upward movement of inflation in June 2025 was primarily driven by the Transport group, which registered an inflation rate of -2.6 percent, improving from -5.6 percent in May. This contributed 33.0 percent to the overall increase in the provincial inflation rate. Notably, the inflation rate for gasoline, which accelerated to -6.5 percent from -12.2 percent, plays a key role in the group’s overall contribution.
Other commodity groups that significantly contributed to the inflation upturn include:
1. Housing, Water, Electricity, Gas, and Other Fuels:
Inflation increased to 1.9 percent from 0.5 percent in May, contributing 29.0 percent to the overall uptrend. This was driven by faster price increases in electricity with an inflation rate of 5.0 percent from 2.7 percent and fuelwood at -2.0 percent from -5.0 percent in May 2025.
2. Clothing and Footwear: Inflation rose to 3.8 percent from 2.3 percent, contributing 9.0 percent to the overall inflation increase. This was due to faster price hikes in clothing at 2.9 percent from 1.1 percent and garments at 2.8 percent from 1.1 percent.
Additionally, the following groups also registered higher inflation rates compared to the previous month:
1. Food and Non-alcoholic Beverages: Increased to -3.1 percent from -3.2 percent in May 2025.
2. Alcoholic Beverages and Tobacco: Increased to 6.5 percent from 5.5 percent in previous month.
3. Furnishings, household equipment and routine household maintenance: Inflation improved to 3.5 percent from 2.6 percent in previous month.
4. Health: Inflation rate rose to 1.0 percent from -0.8 percent from previous month.
5. Information and Communication: Inflation rate surge to 1.4 percent from 0.9 percent from previous month.
6. Restaurants and Accommodation Services: Improvement in the inflation rate is noted this month to 3.3 percent from 2.7 percent.
7. Personal Care and Miscellaneous Goods and Services: Inflation rate noted to rush up to 1.0 percent from 0.5 percent in May 2025.
Despite the overall inflation increase, Recreation, Sports and Culture posted a slower inflation rate of 1.5 percent, down from 2.0 percent in the previous month.
Meanwhile, the following commodity groups recorded no change in inflation:
1. Education Services: 0.0%
2. Financial Services: 0.0%
Top Contributors to the Overall Provincial Inflation Rate of -0.7 Percent
The overall provincial inflation of -0.7 percent in June 2025 was the net result of weighted contributions across commodity groups. The major contributors are:
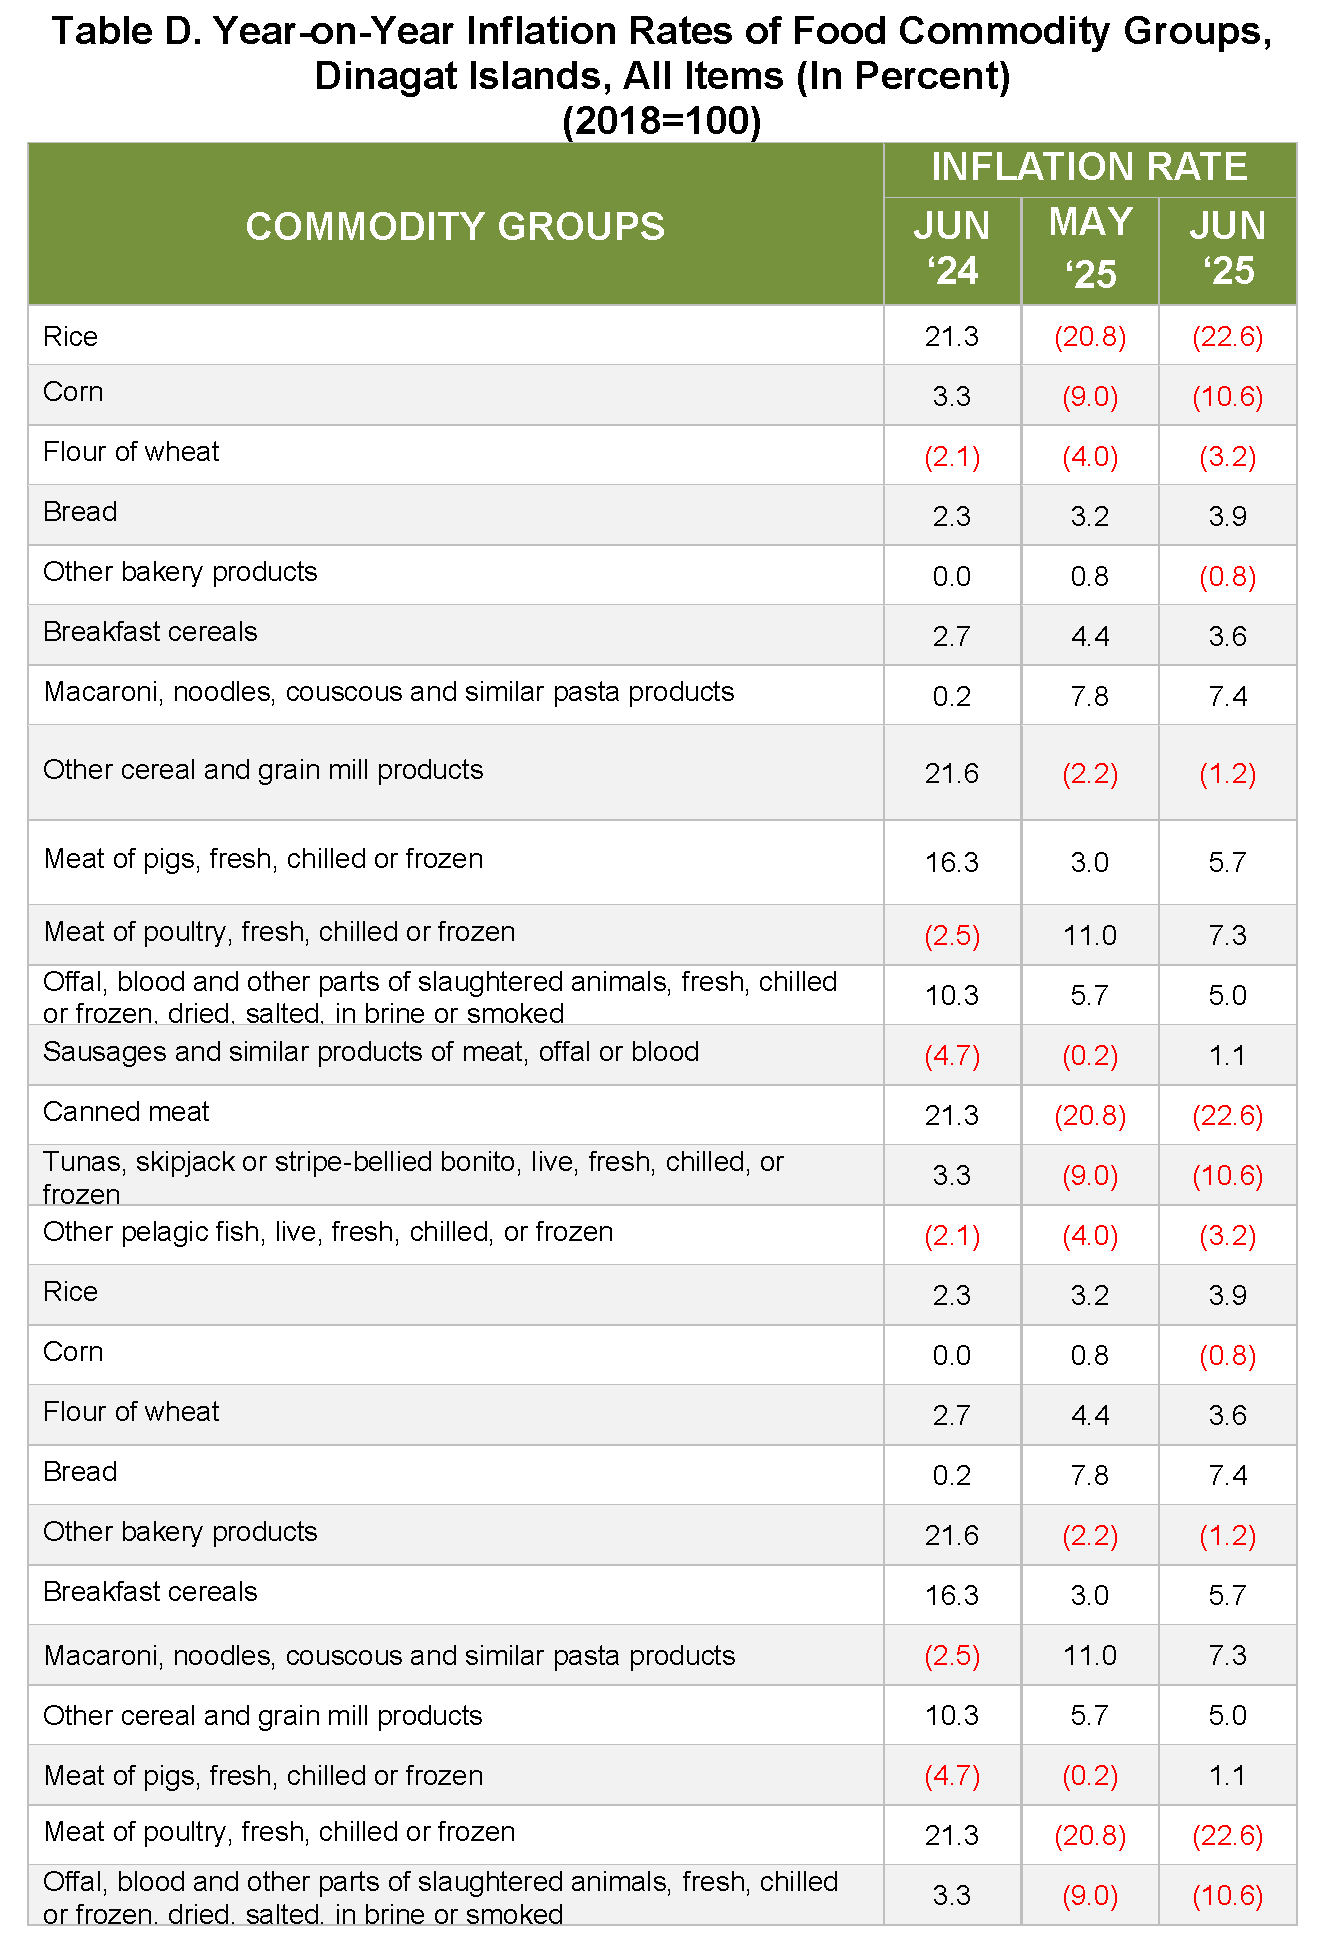
1. Food and Non-Alcoholic Beverages: Contributed -1.48 percentage points or 211.1 percent to overall inflation, mainly due to rice, which posted a sharper decline in inflation to -22.6 percent in June from -20.8 percent in May.
2. Transport: Contributed -0.20 percentage points or 29.1percent to overall inflation, driven by the higher retail prices of gasoline at -6.5 percent from -12.2%).
3. Education and Financial Services: These commodity groups have contribution of 0.0 percent or 0.00 percentage points to the overall provincial inflation.
Food Index
The food index in the province slightly improved in June 2025, posting an inflation rate of -3.1 percent, up from -3.2 percent in May. Notable subgroup movements include:
1. Cereals and cereal products: Inflation declined further to -18.2 percent from -16.8 percent, contributing -7.22 percentage points or 176.1% percent to the total food inflation. The drop was largely due to rice, with inflation falling to -22.6 percent from -20.8 percent.
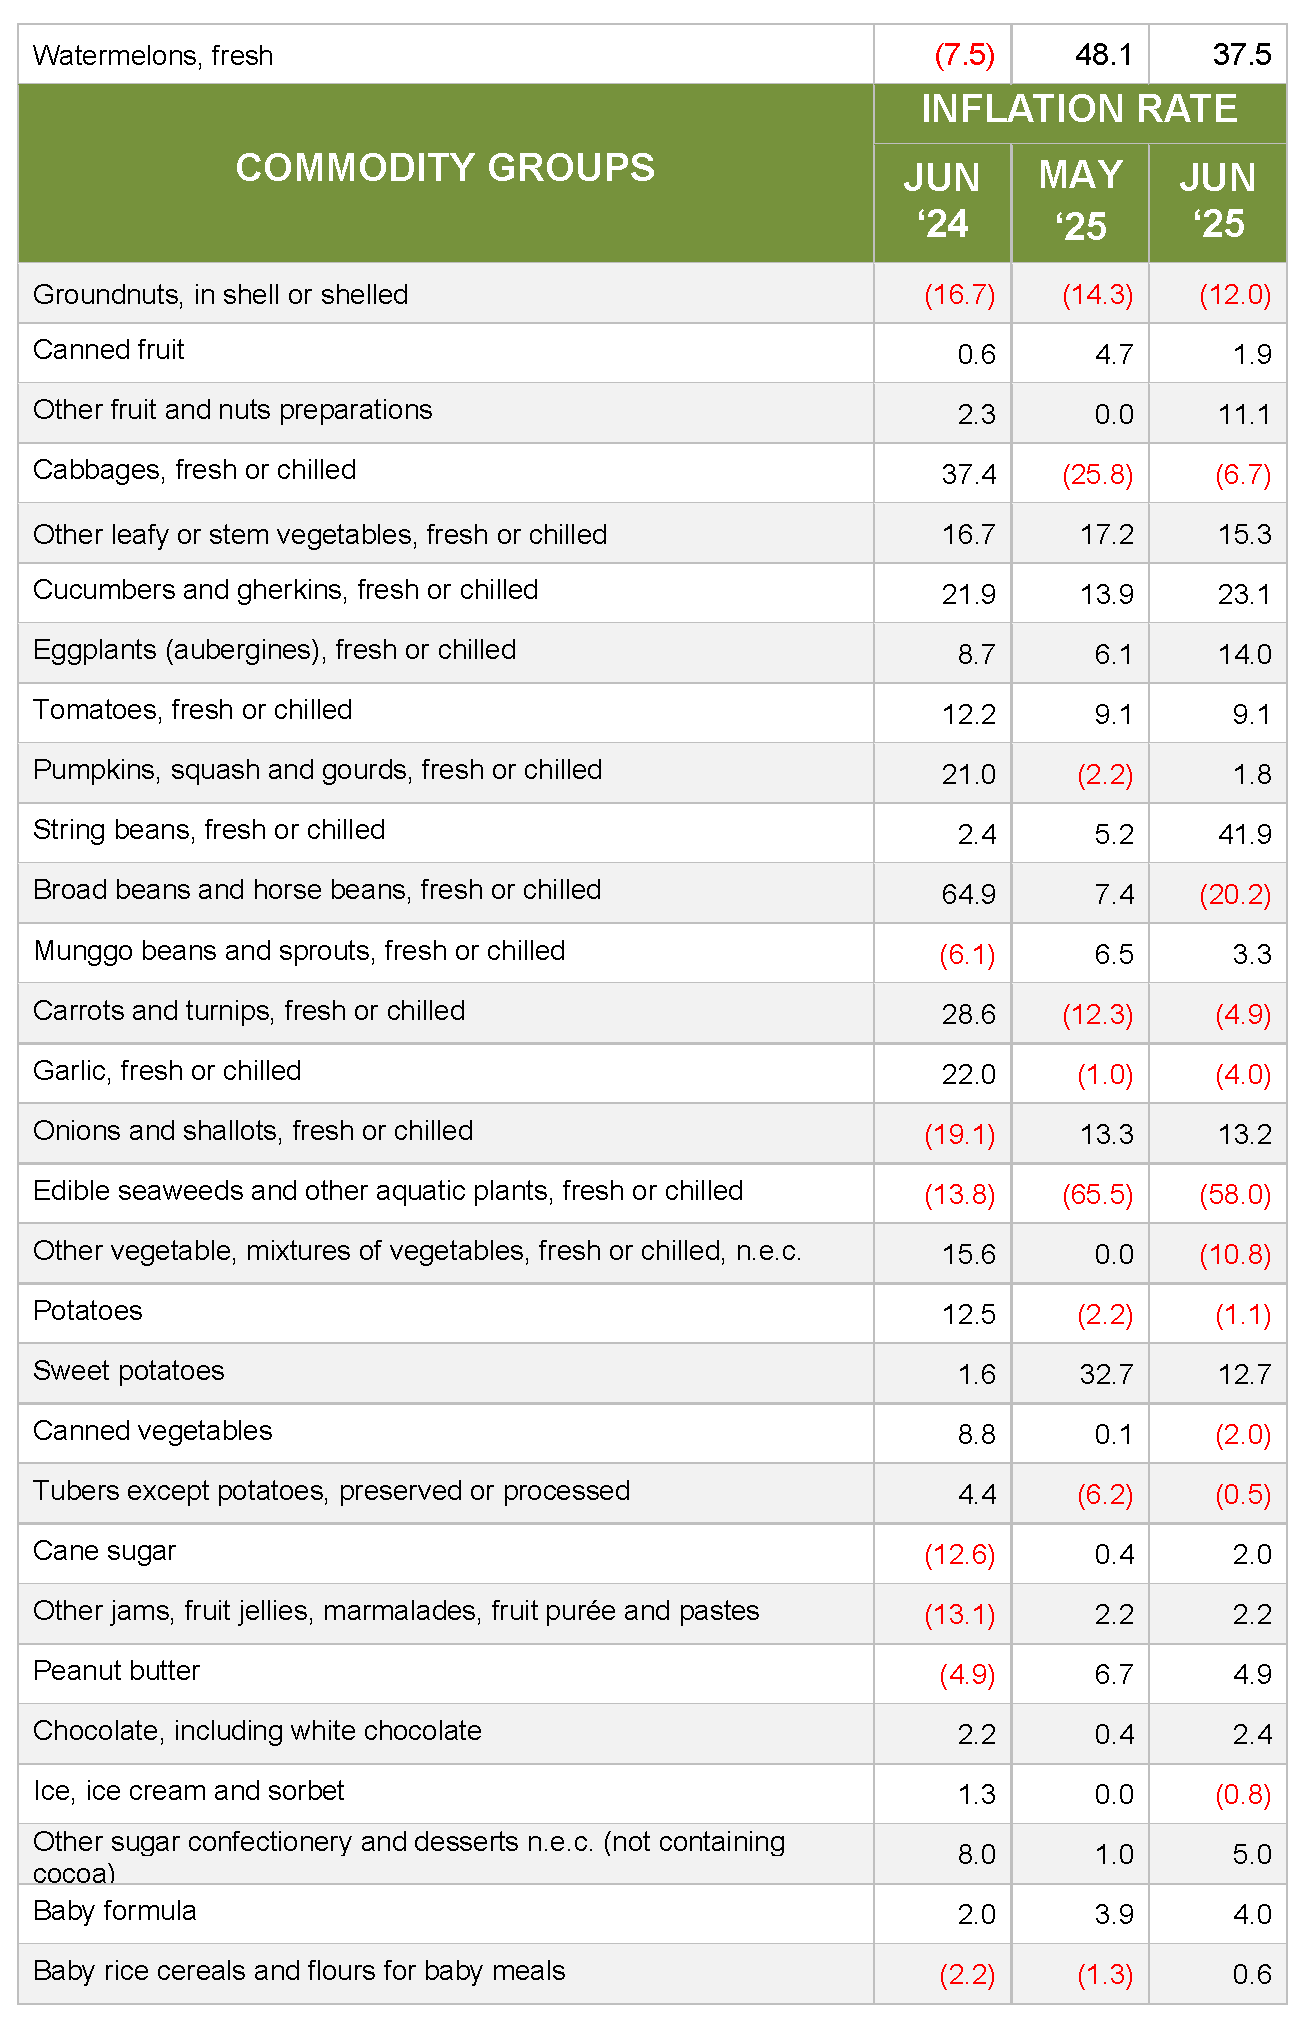
2. Sugar, confectionery and desserts: Inflation rose to 1.4 percent from 0.6 percent, contributing 0.03 percentage points or -0.8 percent to overall food inflation.
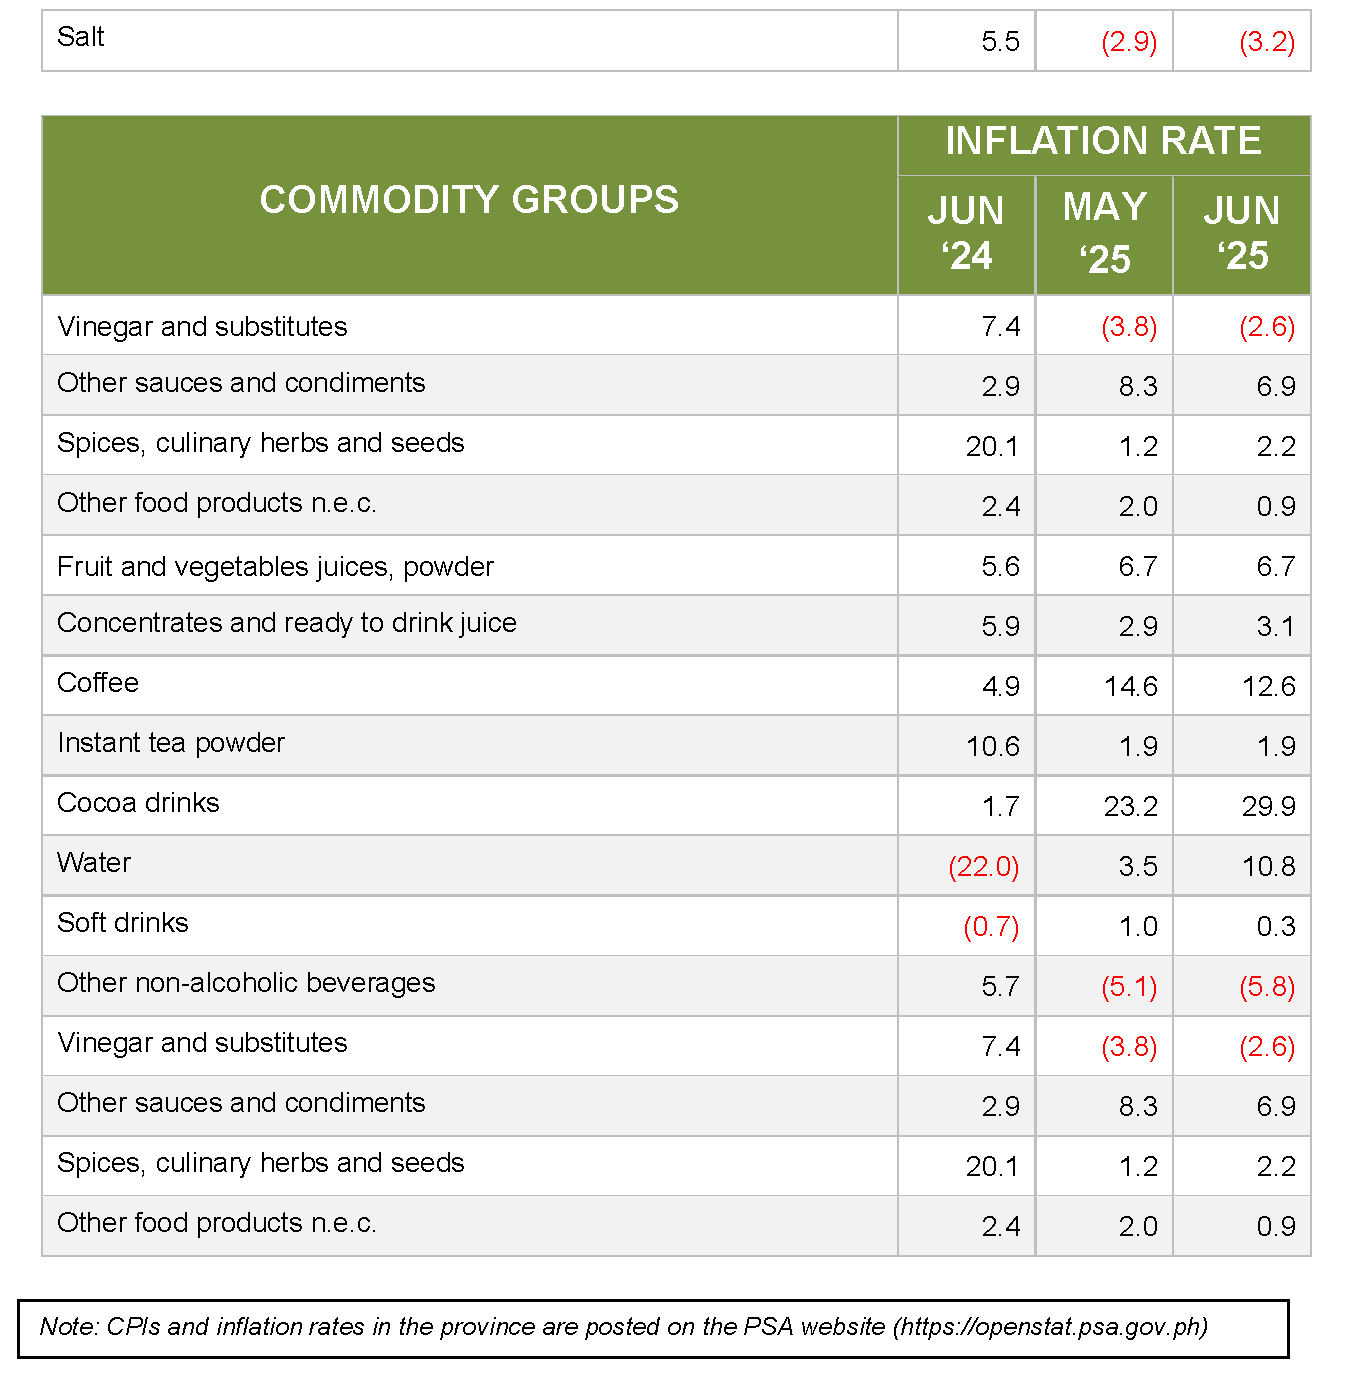
3. Ready-made food and other food products: Inflation increased slightly to 3.0 percent from 2.9 percent, contributing 0.14 percentage points or -3.4 percent to food inflation. The subgroup was notably affected by vinegars and substitutes, which recorded a smaller negative inflation rate of -2.6 percent from -3.8 percent.
Purchasing Power of the Peso
The Purchasing Power of the Peso (PPP) in Dinagat Islands remained steady at P0.74 since April 2025, indicating no change in the average purchasing capacity of the peso during the last three months.
(Sgd.) GLENNBOY C. LISTON
Chief Statistical Specialist
Dinagat Islands-PO
Technical Notes
The Philippine Statistics Authority generates the monthly Consumer Price Index (CPI) based on the nationwide survey of prices for a given basket of goods and services. Two important indicators, the inflation rate and purchasing power of the peso (PPP) are derived from the CPI which is important in monitoring price stability and the value of the country’s currency.
The Consumer Price Index (CPI) is an indicator of the change in the average retail prices of a fixed basket of goods and services commonly purchased by households relative to a base year. It shows how much on the average, prices of goods and services have increased or decreased from a particular reference period known as base year.
The CPI is mostly used in the calculation of the rate and purchasing power of the peso. It is a major statistical series used for economic analysis and as monitoring indicator of government economic policy.
The CPI is also used to adjust other economic series for price changes. Another major importance of the CPI is its use as basis to adjust wages in labor management contracts as well as pensions and retirement benefits.
Inflation rate refers to the rate of change in the average prices of goods and services typically purchased by consumers. It is interpreted in terms of declining purchasing power of money.
The Purchasing Power of the Peso (PPP) indicates the value of the peso in the period under review as compared to the value of the peso in the base period. It is computed as the reciprocal of the CPI for the period under review multiplied by 100.
| Attachment | Size |
|---|---|
|
|
414.33 KB |