

Release Date :
Reference Number :
WPR-2025-069
Caraga
1. Headline Inflation
Headline Inflation in Caraga Drops to 1.4 Percent in January 2025
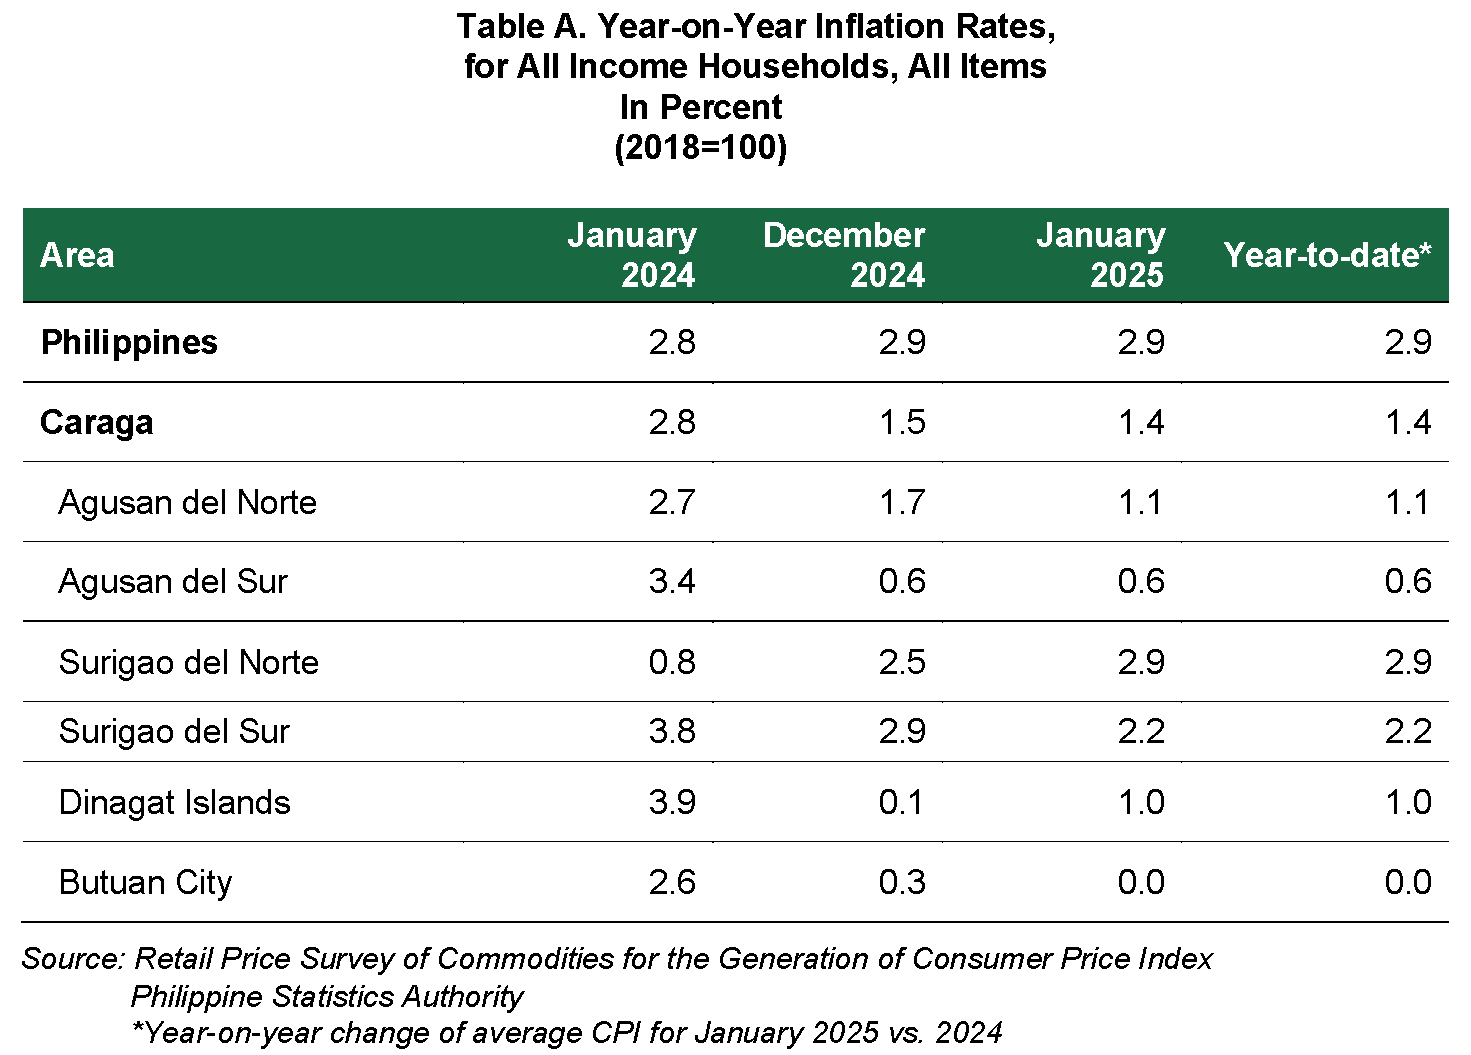
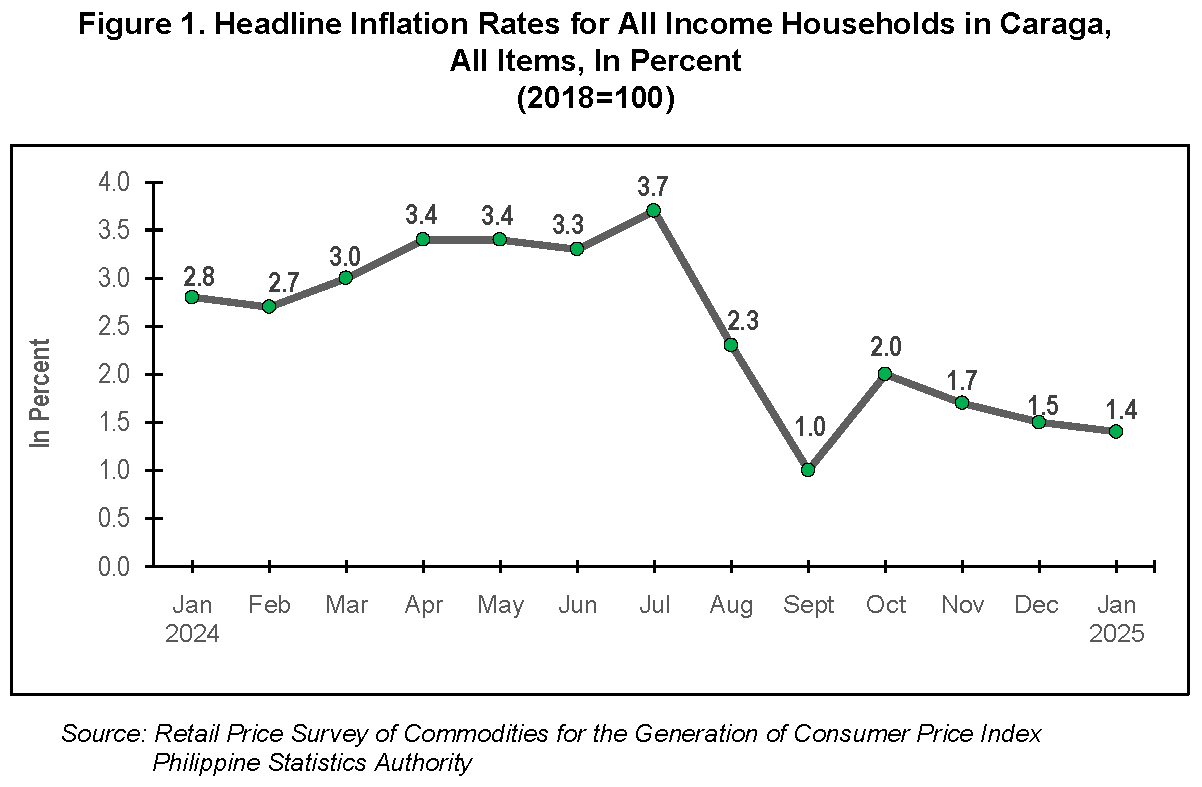
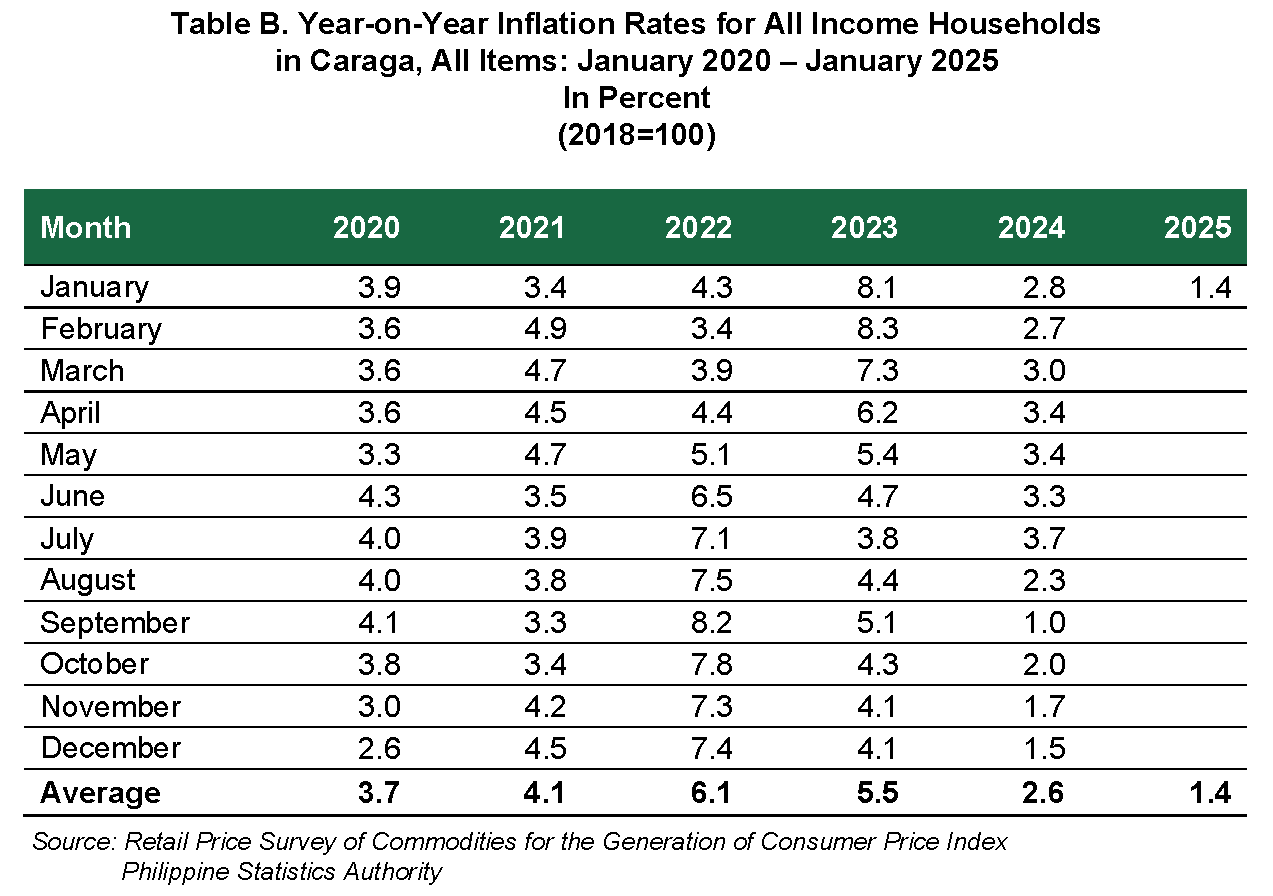
The headline inflation rate for all income households in the Caraga region slightly declined to 1.4 percent in January 2025, down from 1.5 percent in December 2024. In comparison, the inflation rate in January 2024 was significantly higher at 2.8 percent. (Refer to Table A, Table B, and Figure 1 for more details.)
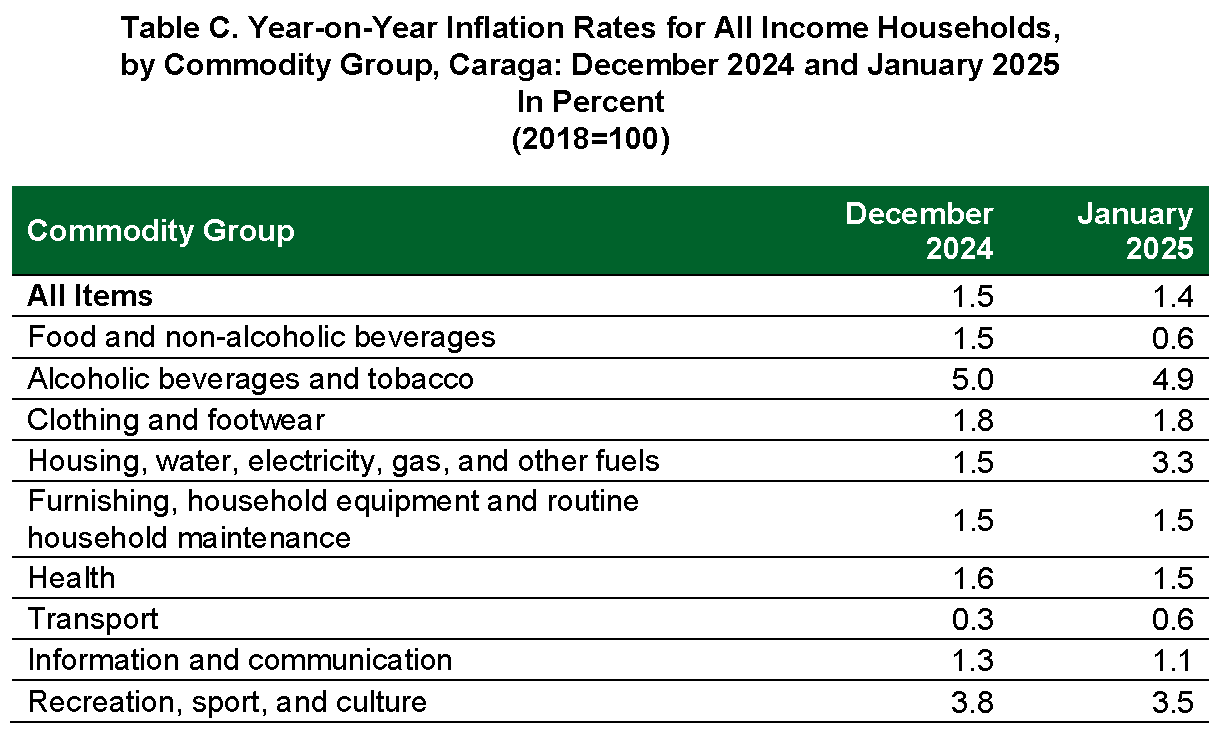
Among the 13 commodity groups, the Food and Non-Alcoholic Beverages category played a crucial role in the overall decrease in inflation for January 2025. The average price increase for this category slowed to 0.6 percent, down from 1.5 percent in December 2024. This commodity group holds a substantial 96.1 percent share in driving the overall inflation trend.Also showing a slowed rate are the information and communication group with 1.1 percent from 1.3 percent in the previous month, personal care, and miscellaneous goods and services at 3.0 percent from 3.1 percent, recreation, sport and culture at 3.5 percent from 3.8 percent, health at 1.5 percent from 1.6 percent and alcoholic beverages and tobacco at 4.9 percent from 5.0 percent.
On the other hand, higher annual growth rates were observed in the indices of the following commodity groups during the month:
a. Housing, Water, Electricity, Gas and Other Fuels, 3.3 percent from 1.5 percent;
b. Transport, 0.6 percent from 0.3 percent;
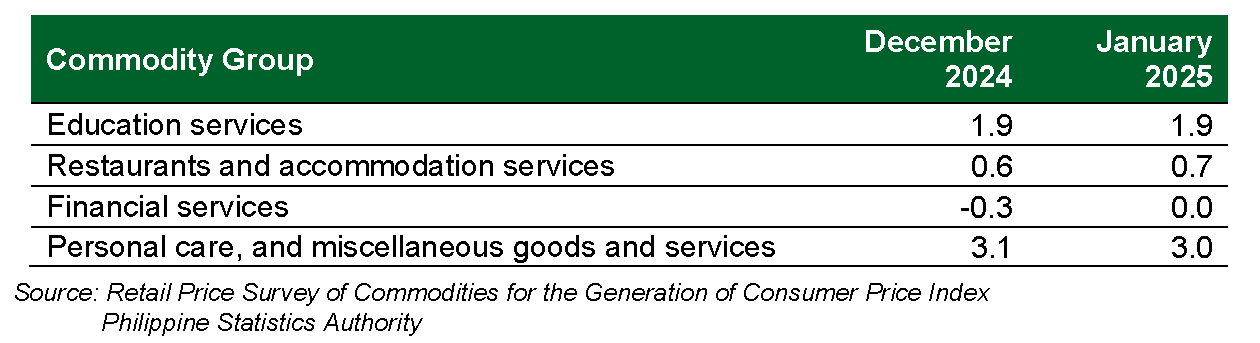
c. Restaurants, and accommodation services, 0.7 percent from 0.6 percent; and
d. Financial services, 0.0 from -0.3 percent.
Meanwhile, commodity groups that exhibited consistent rates were noted in the following:
a. Clothing and footwear, 1.8 percent;
b. Furnishings, household equipment and routine household maintenance, 1.5 percent; and
c. Education services, 1.9 percent.
2. Food Inflation
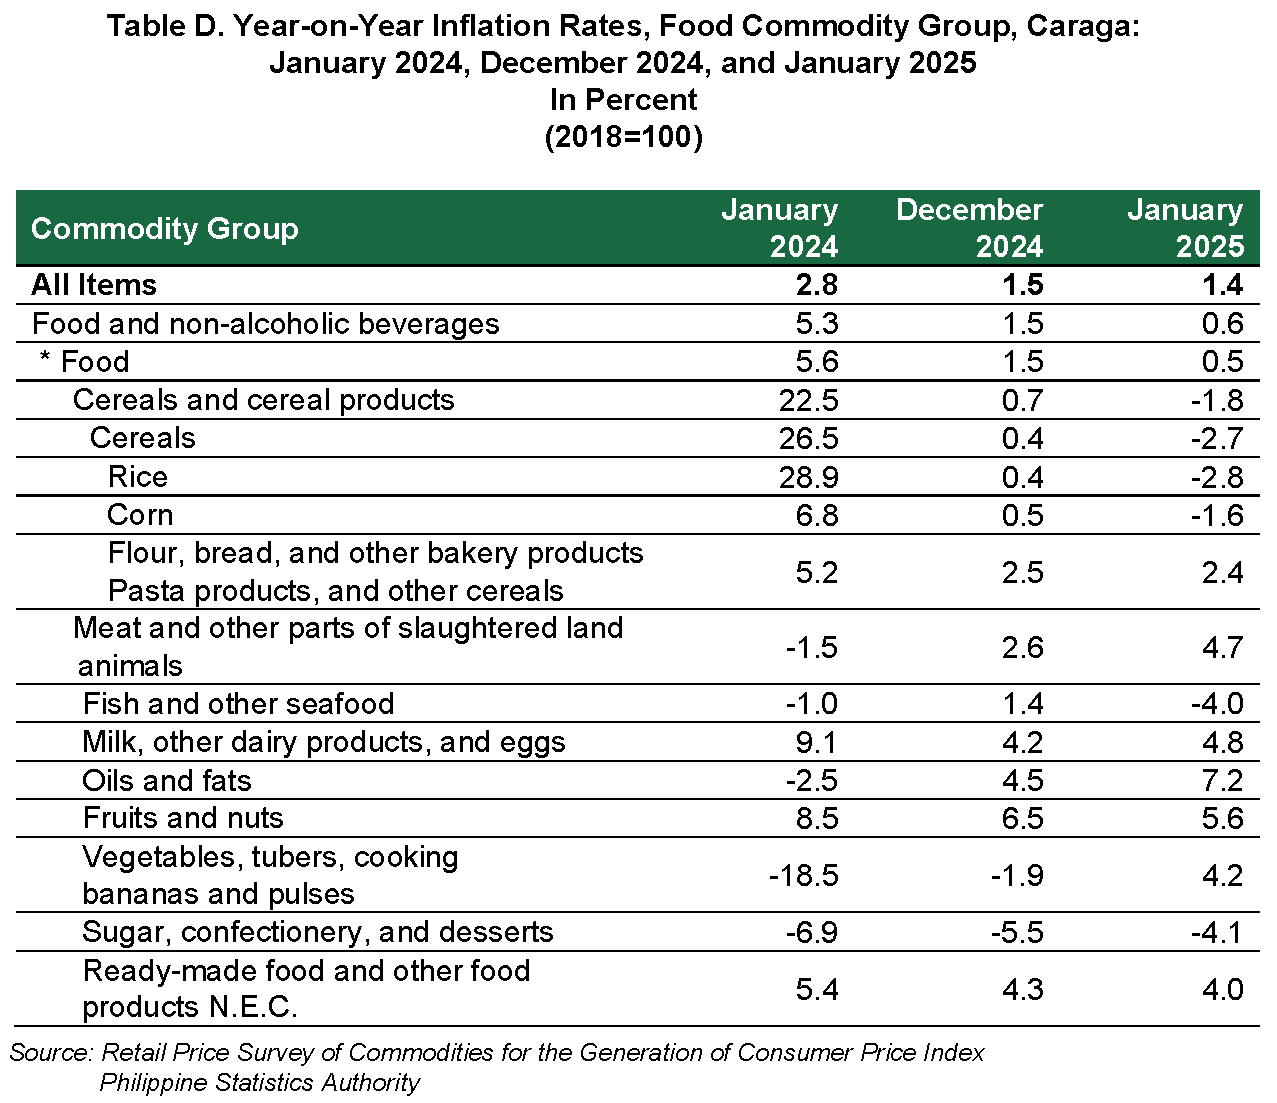
Regional Food Inflation Falls to 0.5 percent in January 2025
Food inflation for all income households in the Caraga region continued its downward trend, dropping to 0.5 percent in January 2025 from 1.5 percent in December 2024. This marks a substantial decline compared to January 2024, when food inflation was recorded at a significantly higher rate of 5.6 percent.
The decline in food inflation in Caraga for January 2025 was primarily driven by significant reductions in the inflation rates of key food categories:
A. Cereals and Cereal Products: The year-on-year growth rate in this category dropped to -1.8 percent this month from 0.7 percent in December 2024. Rice and corn indices showed a sharp decline to -2.8 percent and -1.6 percent from 0.4 percent and 0.5 percent respectively.
B. Fish and Other Seafood: Inflation dropped to -4.0 percent from 1.4 percent, largely due to lower annual average prices of specific fish, particularly flying fish (bangsi).
Furthermore, inflation reductions were observed in the following food groups:
A. Flour, bread and other bakery products, pasta products and other cereals: 2.4 percent from 2.5 percent;
B. Fruits and nuts, 5.6 percent from 6.5 percent; and
C. Ready-made food and other food products n.e.c., 4.0 percent from 4.3 percent.
On the contrary, increased inflation were recorded during the month in the indices of the following food groups:
a. Meat and other parts of slaughtered land animals, 4.7 percent from 2.6 percent;
b. Milk, other dairy products and eggs, 4.8 percent from 4.2 percent;
c. Oils and fats, 7.2 percent from 4.5 percent;
d. Vegetables, tubers, plantains, cooking bananas and pulses, 4.2 percent from -1.9 percent; and
e. Sugar, confectionery and desserts, -4.1 percent from -5.5 percent.
B. Provinces and Highly Urbanized City (HUC)
In January 2025, inflation trends across the Caraga region exhibited variation among its five provinces and one Highly Urbanized City (HUC). Notably, Surigao del Norte and Dinagat Islands recorded increases in their inflation rates. Surigao del Norte's inflation rose to 2.9 percent from 2.5 percent in the previous month, while Dinagat Islands experienced an increase to 1.0 percent from 0.1 percent.
Meanwhile, Butuan City (HUC), Agusan del Norte and Surigao del Sur had decreased its inflation to 0.0 percent, 1.1 percent and 2.2 percent from 0.3 percent, 1.7 percent and 2.9 percent, respectively. However, Agusan del Sur posted a stable rate at 0.6 percent from its December 2024 inflation. (Refer to Table A.)
Note:
CPIs and inflation rates by province and selected city are posted on the PSA website (http://openstat.psa.gov.ph/).
(Sgd.) GUILLERMO M. LIPIO, JR.
(Chief Statistical Specialist)
Officer-In-Charge
PSA RSSO XIII
TECHNICAL NOTES
The Philippine Statistics Authority generates and announces the monthly Consumer Price Index (CPI) based on the nationwide survey of prices for a given basket of goods and services. Two important indicators, the inflation rate and purchasing power of the peso (PPP), are derived from the CPI which are important in monitoring price stability and the value of the country’s currency.
The Consumer Price Index (CPI) is an indicator of the change in the average retail prices of a fixed basket of goods and services commonly purchased by households relative to a base year. It shows how much on the average, prices of goods and services have increased or decreased from a particular reference period known as base year.
Inflation Rate refers to the rate of change in the average prices of goods and services typically purchased by consumers. It is interpreted in terms of declining purchasing power of money.
Disinflation refers to a situation where the general level of prices is increasing but at a decreasing rate.
Deflation refers to a situation where the general level of prices is falling and the rate is below zero percent.
The Purchasing Power of the Peso (PPP) indicates the value of the peso in the period under review as compared to the value of the peso in the base period. It is computed as the reciprocal of the CPI for the period under review multiplied by 100.
Statistical Table refers to the statistical data presenting a reference table for the CPI, and Inflation Rate of each commodity groups and food items that are used for attachments.
| Attachment | Size |
|---|---|
|
|
161.17 KB |