

Release Date :
Reference Number :
SR-2024-09-0054
SDS Summary Inflation Report Consumer Price Index (2018=100) August 2024
Headline Inflation
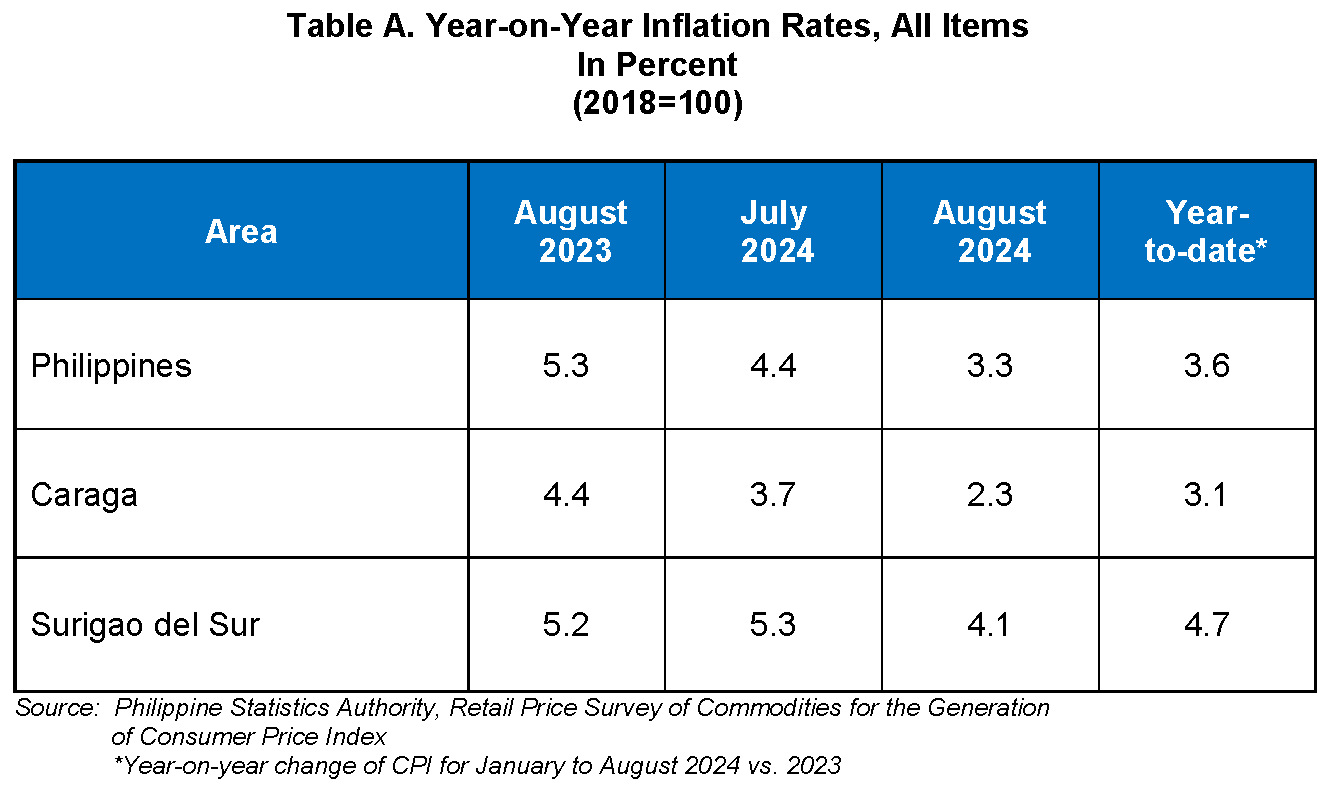
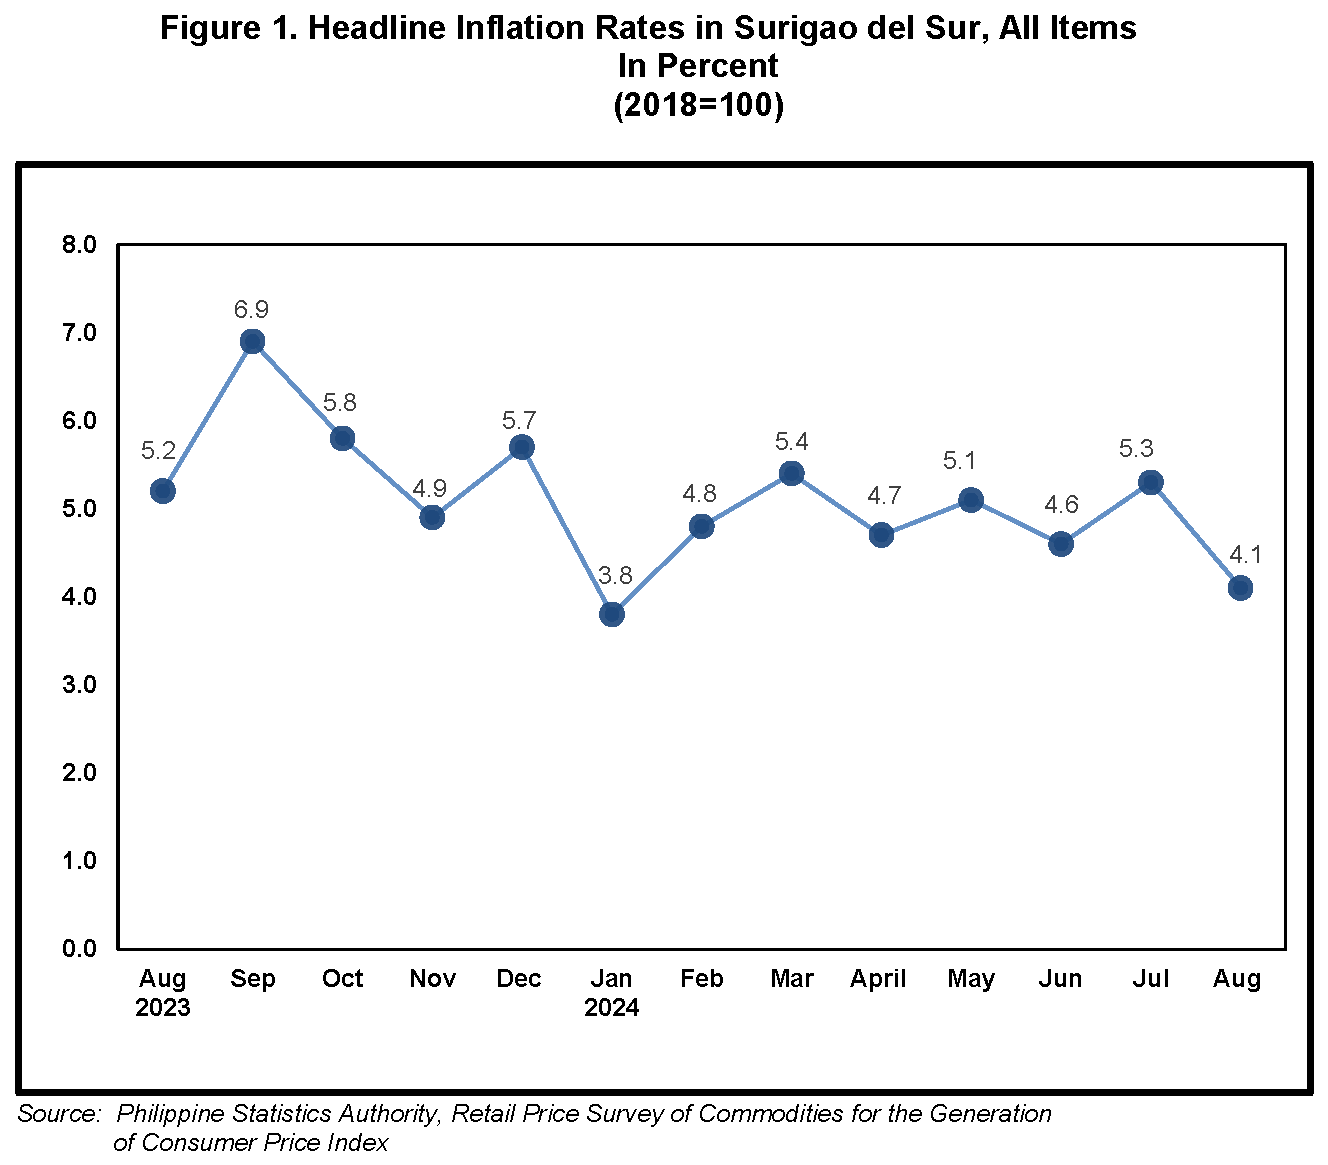
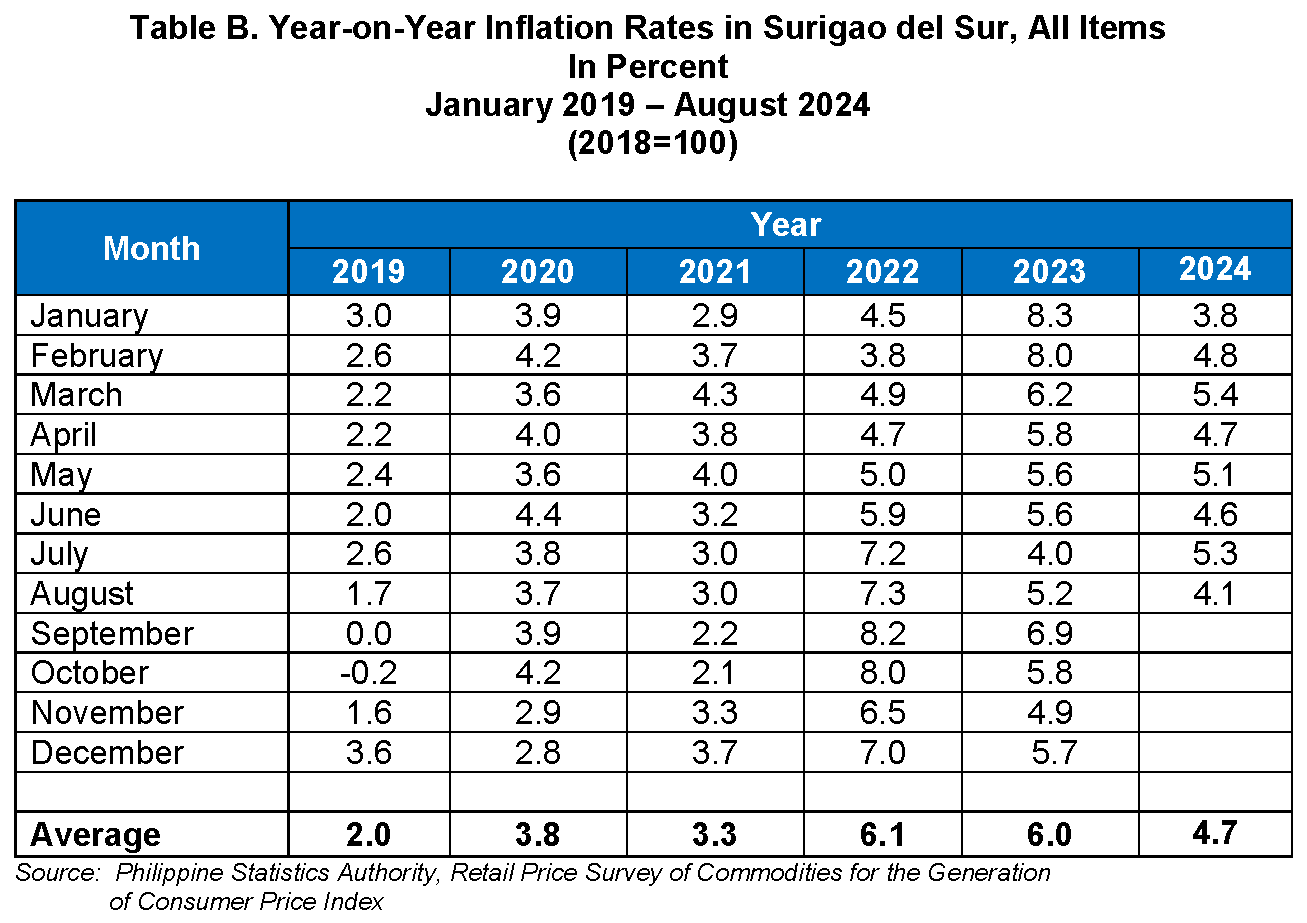
The headline inflation or overall inflation in Surigao del Sur decreased to 4.1 percent in August 2024, from 5.3 percent in July 2024. Inflation in August 2023 was higher at
5.2 percent. (Tables A and B)
For comparison, the provincial headline inflation in August 2024 is faster than the regional and national headline inflation at 2.3 percent and 3.3 percent, respectively.
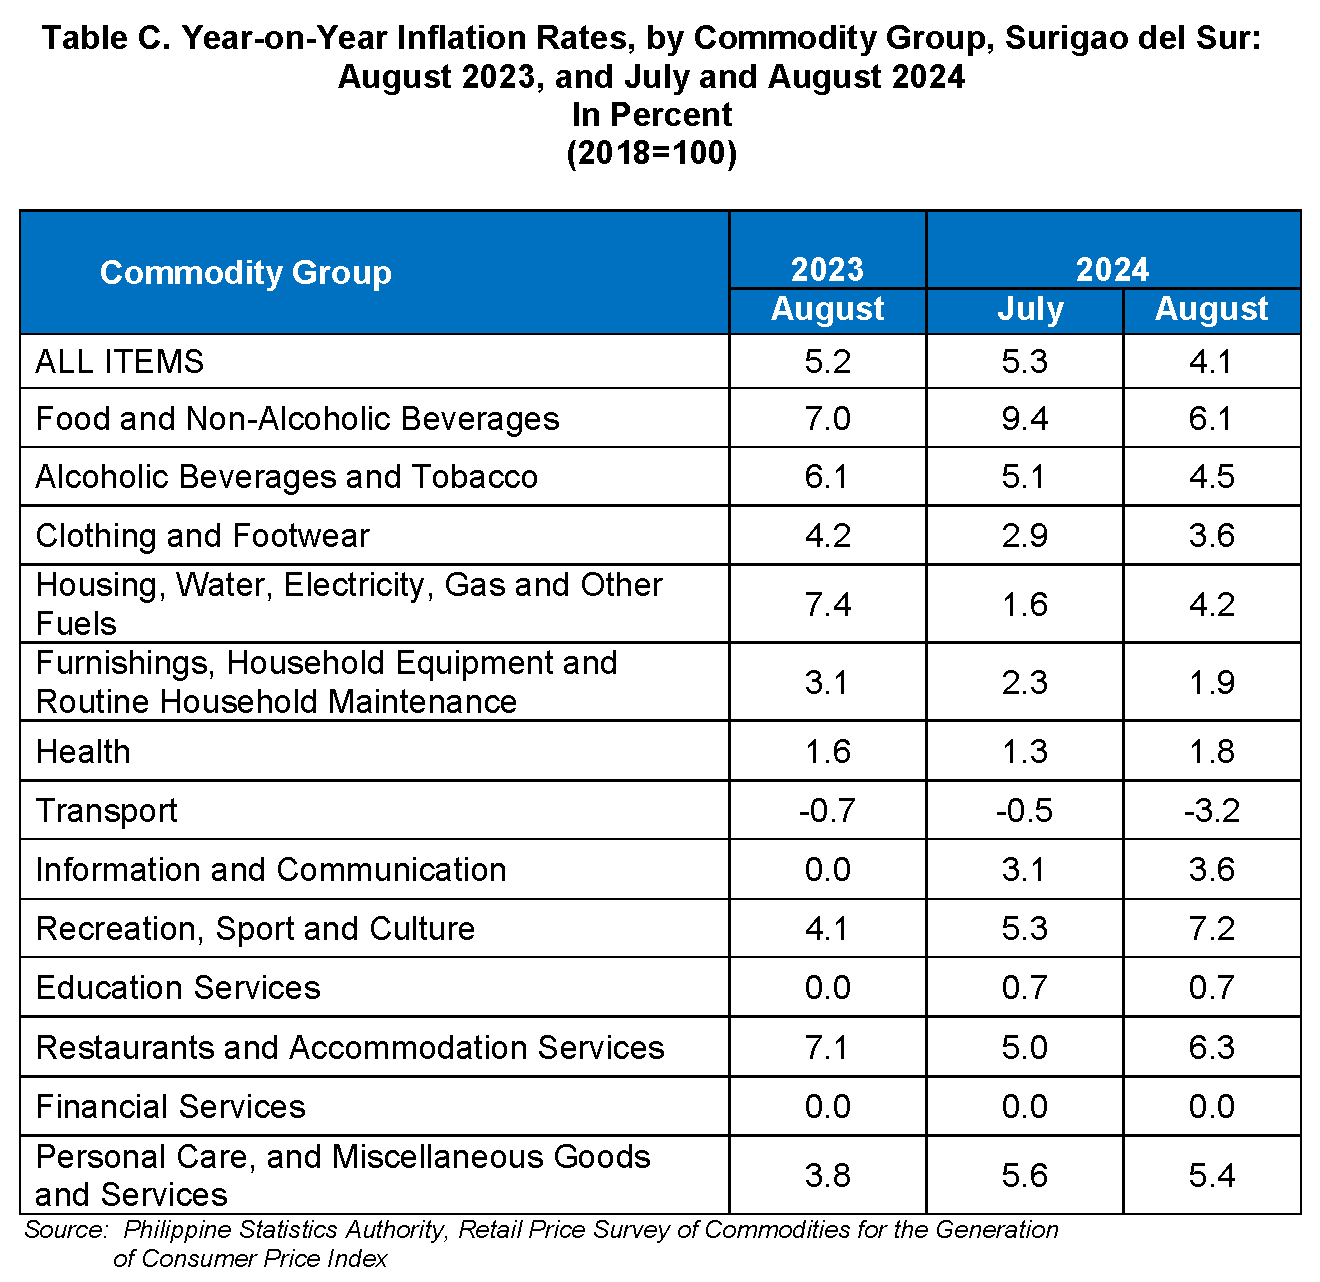
The downtrend of overall inflation in August 2024 was mainly brought by the heavily weighted food and non-alcoholic beverages which recorded an inflation rate of 6.1 percent from 9.4 percent in the previous month.
Compared with the previous month’s inflation rate, lower annual increments were noted in the indices of the following commodity groups during the months:
a) Alcoholic beverages and tobacco, 4.5 percent from 5.1 percent;
b) Furnishings, household equipment and routine household maintenance,
1.9 percent from 2.3 percent;
c) Transport, -3.2 percent from -0.5 percent; and
d) Personal care, and miscellaneous goods and services, 5.4 percent from
5.6 percent.
On the contrary, higher inflation rates were observed in the following commodity groups:
a) Clothing and footwear, 3.6 percent from 2.9 percent;
b) Housing, water, electricity, gas and other fuels, 4.2 percent from 1.6 percent;
c) Health, 1.8 percent from 1.3 percent;
e) Information and communication, 3.6 percent from 3.1 percent;
d) Recreation, sport and culture, 7.2 percent from 5.3 percent; and
e) Restaurants and accommodation services, 6.3 percent from 5.0 percent.
Meanwhile, the indices of education services, and financial services retained their previous month’s annual rates. (Table C)
Food Inflation
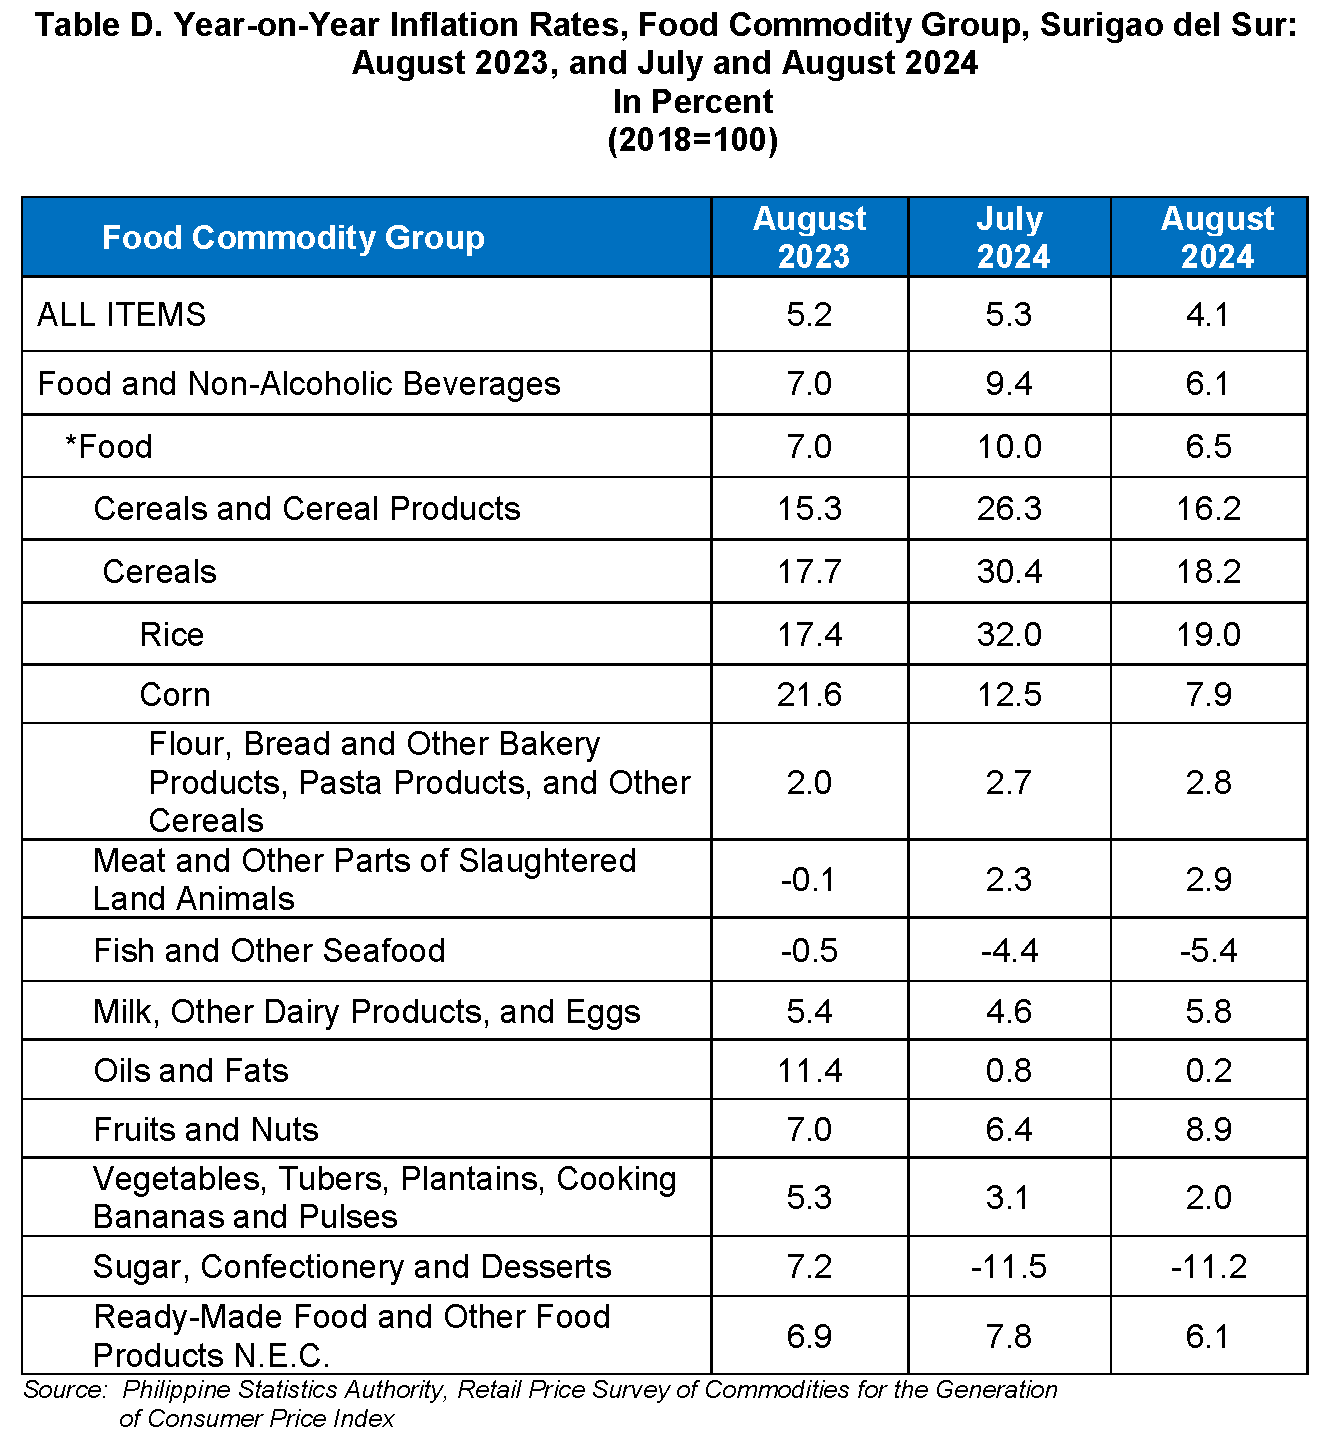
At the provincial level, the food index decreased to 6.5 percent in August 2024, from 10.0 percent in the previous month. In August 2023, food inflation was higher at 7.0 percent.
Likewise, the following food groups exhibited lower inflation rates during the month:
a. Cereals and cereal products, 16.2 percent from 26.3 percent;
b. Fish and other seafood, -5.4 percent from -4.4 percent;
c. Oils and fats, 0.2 percent from 0.8 percent;
d. Vegetables, tubers, plantains, cooking bananas and pulses, 2.0 percent
from 3.1 percent; and
e. Ready-made food and other food products n.e.c, 6.1 percent from 7.8 percent.
On the contrary, higher inflation rates were observed in the following commodity groups:
a. Meat and other parts of slaughtered land animals, 2.9 percent from
2.3 percent;
b. Milk, other dairy products and eggs, 5.8 percent from 4.6 percent;
c. Fruits and nuts, 8.9 percent from 6.4 percent; and
d. Sugar, confectionery and desserts, -11.2 percent and -11.5 percent.
TECHNICAL NOTES
Consumer Price Index (CPI) – The CPI is an indicator of the change in the average retail prices of a fixed basket of goods and services commonly purchased by households relative to a base year.
Components of the CPI
a. Base Period – The reference data or base period is the benchmark or reference date or period at which the index is taken as equal to 100.
b. Market Basket - A sample of the thousands of varieties of goods purchased for consumption and services availed by the households in the country selected to represent the composite price behavior of all goods and services purchased by consumers.
c. Weighing System – The weighing pattern uses the expenditures on various consumer items purchased by households as a proportion to total expenditure.
d. Formula – The formula used in computing the CPI is the weighted arithmetic mean of price relatives, the Laspeyres formula with a fixed base year period (2018) weights.
e. Geographic Coverage – CPI values are computed at the national, regional, and provincial levels, and for selected cities.
Inflation Rate (IR) – is the rate of change of the CPI expressed in percent. Inflation is interpreted in terms of the declining purchasing power of peso.
Purchasing Power of Peso (PPP) – shows how much the peso in the base period is worth in the current period. It is computed as the reciprocal of the CPI for the period under review multiplied by 100.
Approved for release:
(Sgd.) RUEL L. DRES
Chief Statistical Specialist
| Attachment | Size |
|---|---|
|
|
258.86 KB |