

Release Date :
Reference Number :
WPR-2025-175
1. Headline Inflation
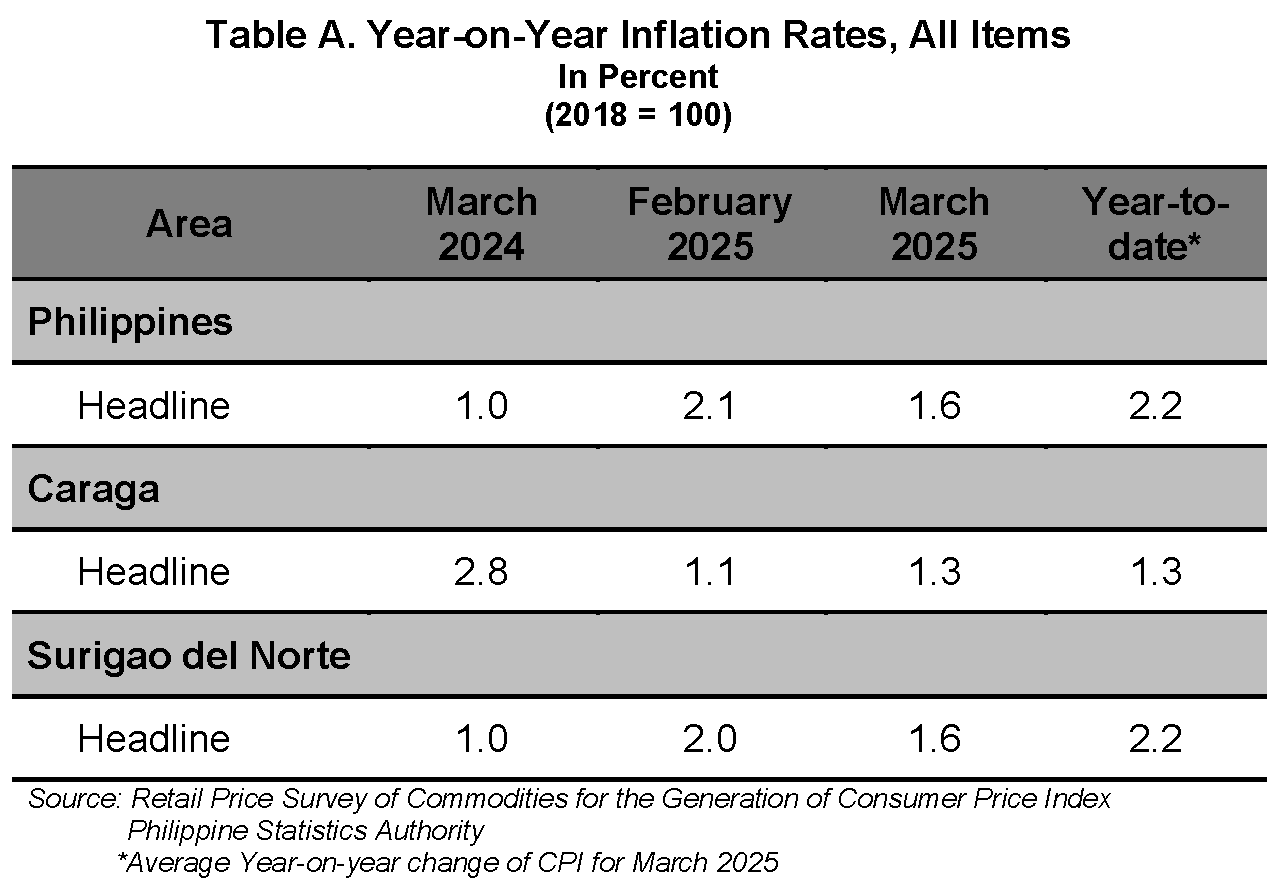
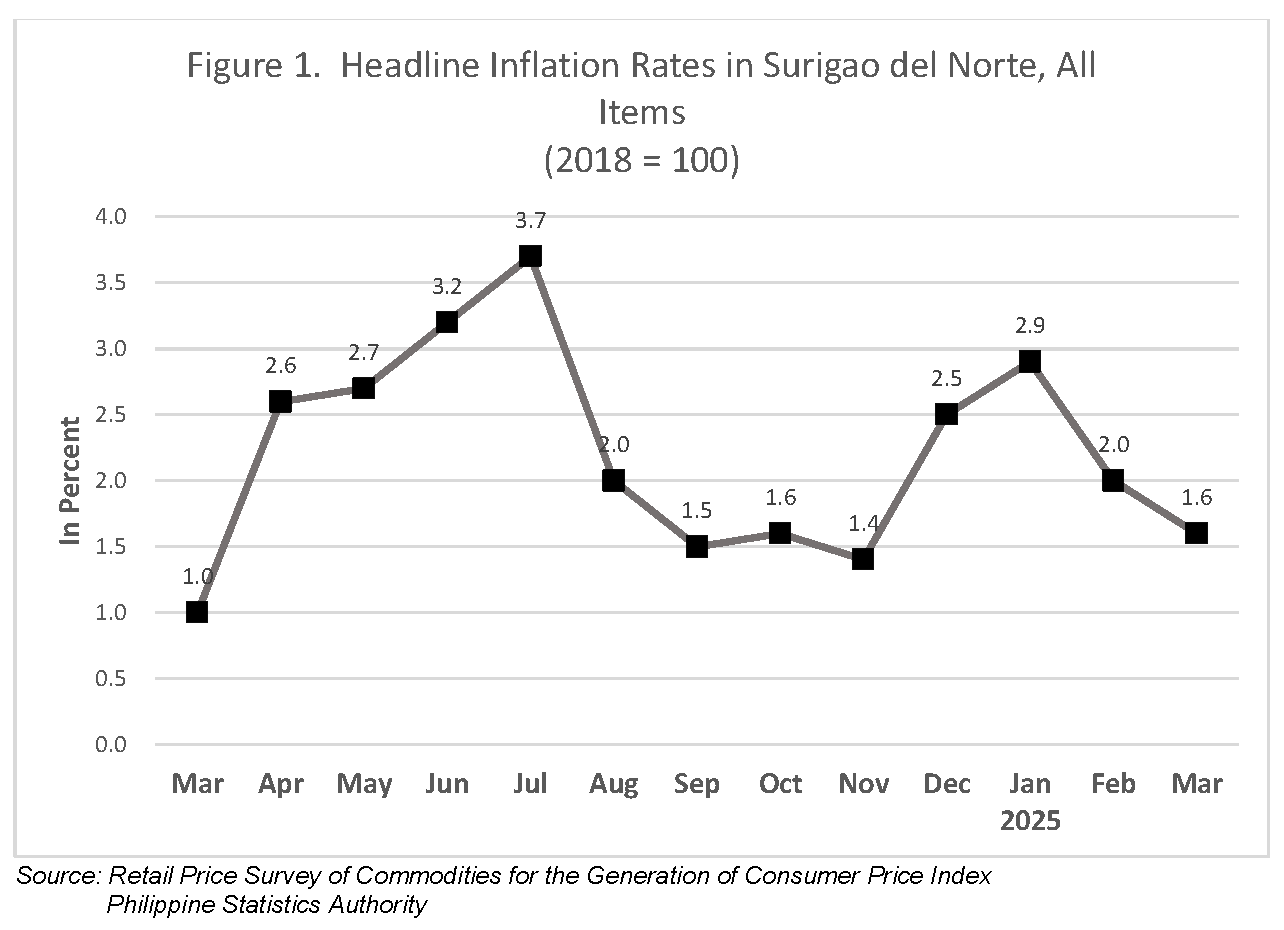
The headline inflation in the province of Surigao del Norte decrease to 1.6 percent in March 2025, from 2.0 percent in February 2025. The decrease is 20 percent from the previous month, February 2025 .The average inflation for the past 12 months of the year stood at 2.3 percent. (Table A and Figure 1)
For comparison, the provincial headline inflation is higher compared with the regional, but similar with national headline inflation in March 2025.
1.1 Main Drivers to the Downward Trend of the Headline Inflation
The decrease in the inflation of the province in March 2025 was mainly brought about by the annual decrease in the Housing, Water, Electricity, Gas and Other Fuels; Furnishings, Household Equipment and Routine Household Maintenance; and Personal Care, and Miscellaneous Goods and Services. Aside from these commodity groups; Alcoholic Beverages and Tobacco; Transport; Information and Communication; and Restaurants and Accommodation Services also present a decrease in their year-on-year inflation rate. (Table 10)
On the other hand, an increase in the year-on-year inflation rate of the four commodity groups namely: Food and Non-Alcoholic Beverages; Clothing and Footwear; Health; and Recreation, Sport and Culture was observed.
The rest of the commodity groups retained their previous month’s inflation rates or had zero percent annual growth rates. These are:
a. Education Services; and
b. Financial Services;
1.2 Main Contributors to the Headline Inflation
The top three commodity groups contributing to the March 2025 overall inflation were the following: (Table 11)
a. Food and non-alcoholic beverages with 70.6 percent share or 1.13 percentage points;
b. Alcoholic beverages and tobacco with 12.9 percent share or 0.21 percentage points; and
c. Personal care, and miscellaneous goods and services with 7.5 percent share or 0.12 percentage points.
Among the three, a. Food and non-alcoholic beverages is the only commodity group with an increasing trend in the iflation rate, which is -0.2 in February 2025 to 2.4 in March 2025.
2. Food Index
This month’s food index, which is 2.1 has shown an increase from -0.6 in February 2025. In March 2024, the food index was lower at 1.6 percent. (Table 7)
2.1 Main Drivers to the Downward Trend of the Headline Food Inflation
The three major contributors to the increasing trend of the food inflation rate from February to March 2025 are fish and other seafood; meat and other parts of slaughtered land animals; and sugar, confectionery and desserts. Aside from these commodity groups; milk, other dairy products and eggs; and oils and fats also present an increase in their inflation.
On the other hand, all the other food groups namely; Cereals and cereal products; Fruits and nuts; Vegetables, tubers, plantains, cooking bananas and pulses; and Ready-made food and other food products n.e.c. have decreased in their inflation rate from February to March 2025. (Table 12)
2.2 Main Contributors to the Food Inflation
Food inflation shared 45.2 percent to the overall inflation. The top three food groups in terms of contribution to the food inflation during the month were the following: (Table 13)
d. Fish and other seafood with 136.7 percent share or 2.87 percentage points;
e. Meat and other parts of slaughtered land animals with 80.9 percent share or 1.70 percentage points; and
f. Milk, other dairy products and eggs with 21.7 percent share or 0.46 percentage points.
Approved for release:
(Sgd.) VIRGILIO G. AVELINA, JR
(Supervising Statistical Specialist)
Officer-in-Charge
PSA Surigao del Norte
| Attachment | Size |
|---|---|
|
|
279.71 KB |
|
|
93.03 KB |