

Release Date :
Reference Number :
WPR-2025-071
Headline Inflation
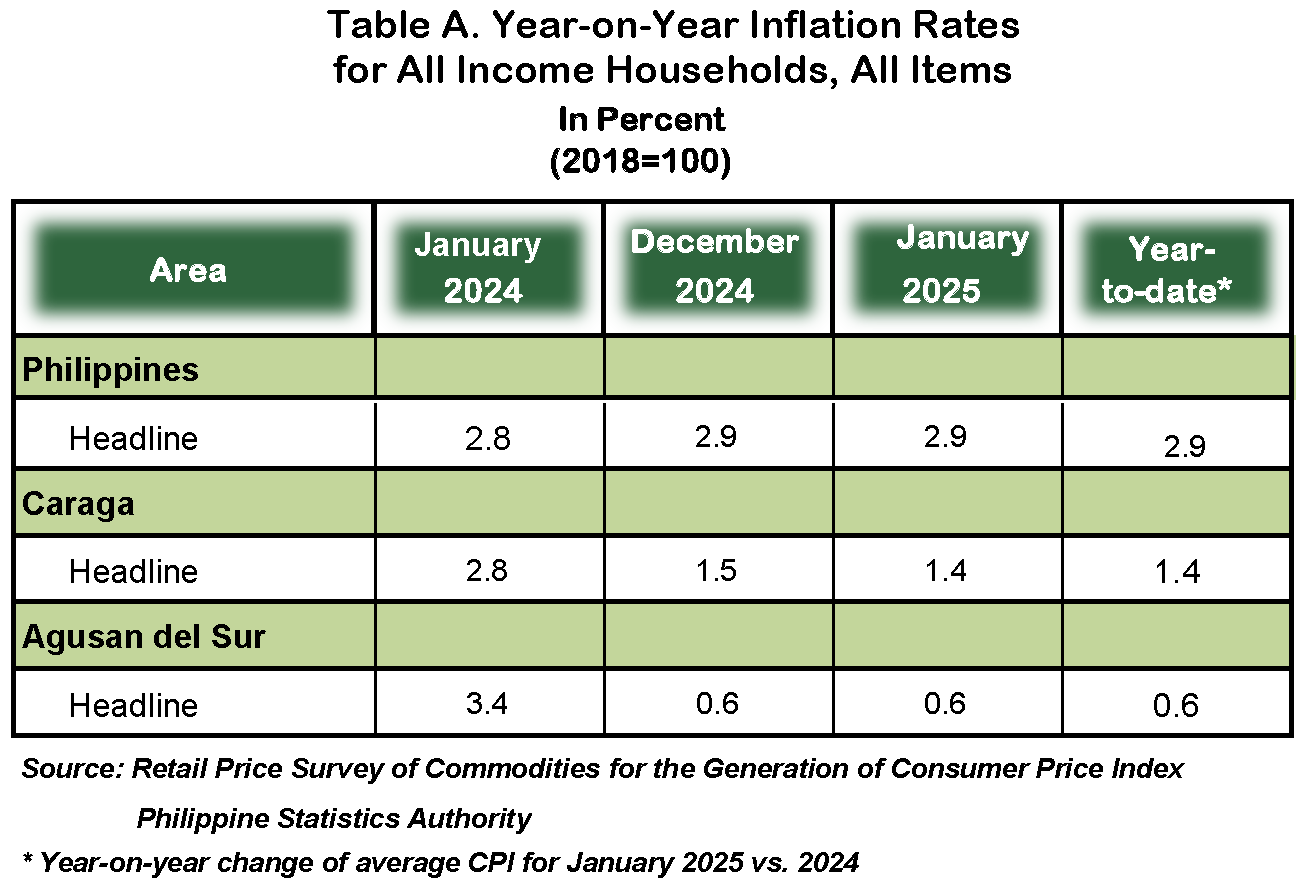
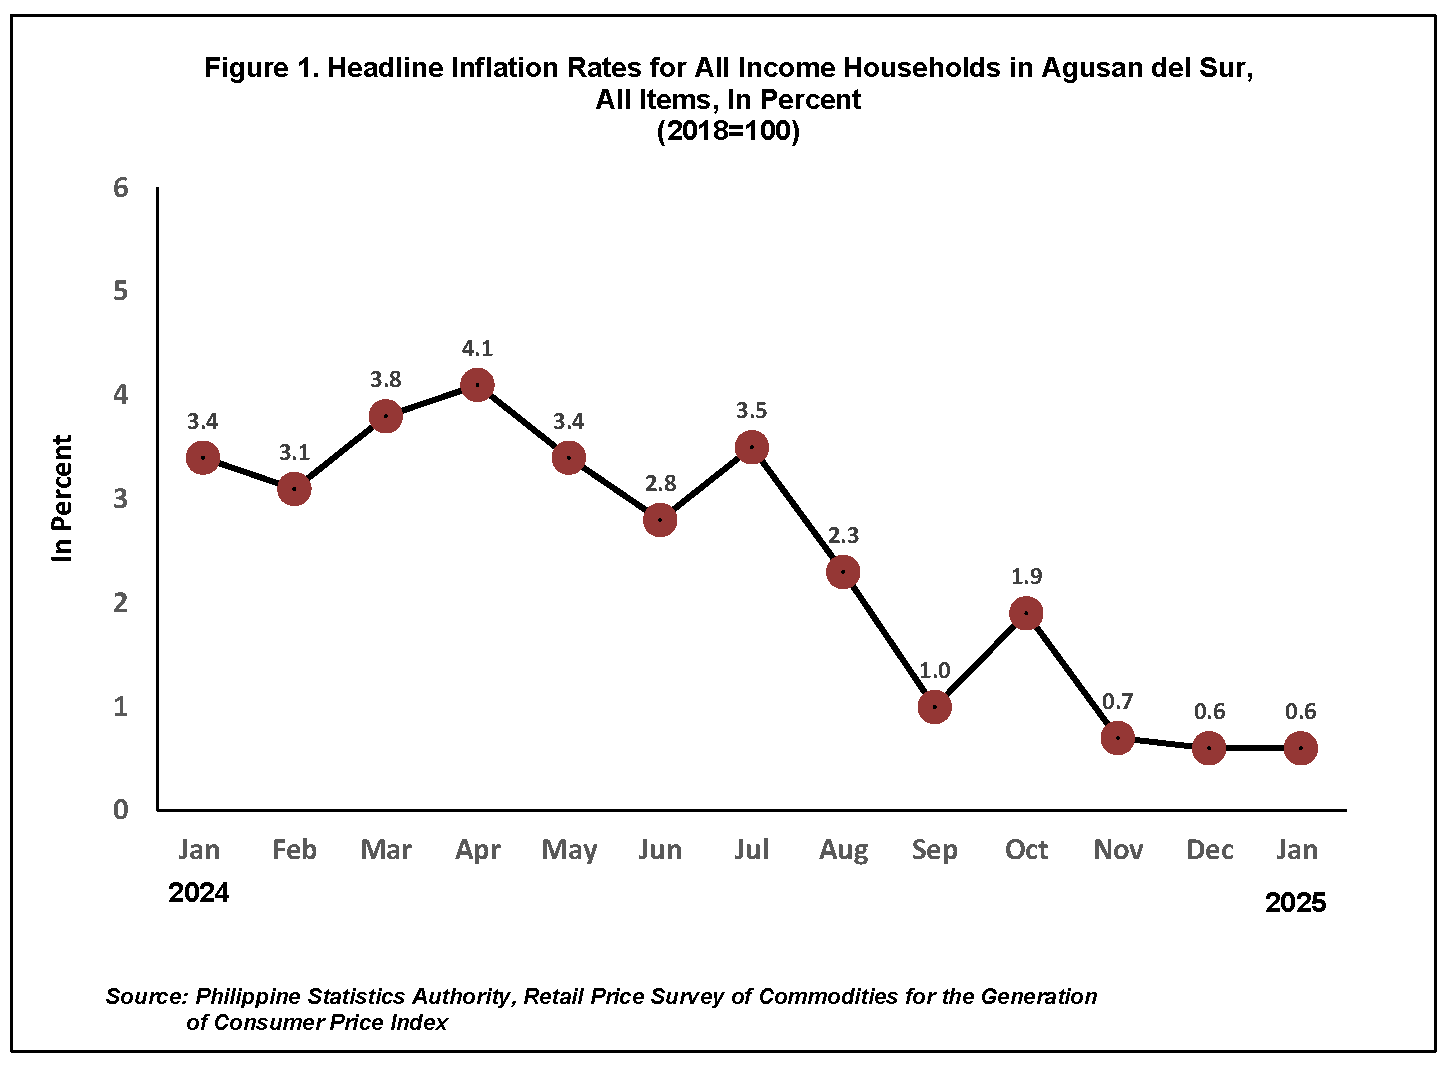
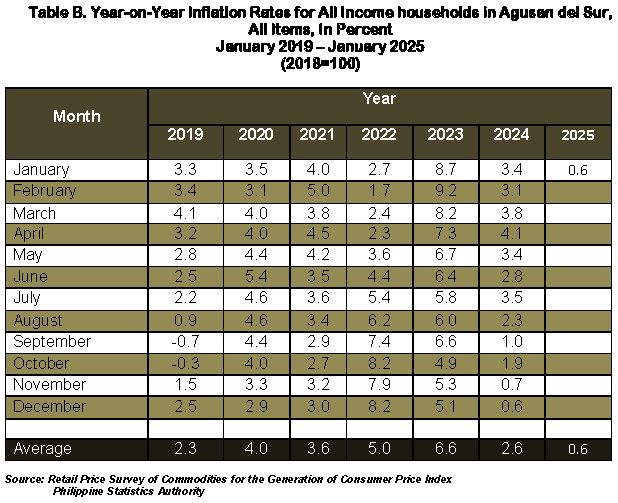
The headline inflation for all income households in the province of Agusan del Sur remained stable at 0.6 percent from December 2024 to January 2025. Inflation in January 2024 was elevated at 3.4 percent.
For comparison, the provincial headline inflation for all income households in January 2025 is decelerating than the regional and national inflation at 1.4 and 2.9 percent respectively.
With stable prices in headline inflation, four out of 13 commodity groups showed rising inflation in January 2025. This was mainly influenced by Alcoholic Beverages, and Tobacco, 2.5 percent from 2.1 percent followed by Information and Communication, 1.3percent from 1.2 percent.
In addition, higher annual growth rate was observed in the indices of the following:
a) Financial Services, (0.0) percent from -1.4 percent;
b) Transport, -0.2 percent from -0.8 percent and
c) Housing, Water, Electricity, Gas and other fuels, -1.3 percent from -3.4 percent;
Meanwhile, lower annual increments which contributed to the constant price condition during the month were depicted in the indices of the commodity groups of the following:
a) Food and non-alcoholic beverages, 1.1 percent from 2.1 percent;
b) Furnishings, household equipment and routine maintenance, 0.4 percent from 0.6 percent;
c) Health, 1.0 percent from 2.0 percent;
d) Recreation, Sport and Culture, 2.2 percent from 2.4 percent and
e) Personal care and miscellaneous goods and services, 1.9 percent from 2.5 percent.
The rest of the commodity groups that maintained steady rates were reported in the indices of Clothing and Footwear, 0.1 percent; Education Services, 0.3 percent and Restaurants and Accommodation Services, 0.0 percent.
Food Inflation
Food inflation for all income households at the provincial level continued to drop to 1.1 percent in January 2025 from 2.1 percent in December 2024. In January 2024, food inflation was higher at 5.1 percent.
The downtrend on inflation for food in January 2025 was essentially caused by the lower year-on-year growth rate on fish and other seafoods, -5.2 percent from 2.7 percent, subsequently, rice, 2.6 percent from 5.5 percent in December 2024.
Furthermore, inflation on milk, other dairy products and eggs, 3.7 percent from 3.9 percent and ready-made food and other food products, 2.8 percent from 3.1 percent declined in January 2025 as compared with the previous month.
On the contrary, food groups which recorded an increase in inflation rate during the month were the following:
a) Meat and other parts of slaughtered land animals, 2.4 percent from 1.4 percent;
b) Oils and fats, 21.2 percent from 15.1 percent;
c) Fruits and nuts, 6.2 percent from 5.2 percent;
d) Vegetables, tubers, plantains, cooking bananas and pulses, 6.2 percent from
-6.3 percent and
e) Sugar, confectionery and desserts, -6.7 percent from -7.6 percent.
(Sgd.) DEMETRIO T. DEJOLDE JR.
Chief Statistical Specialist
| Attachment | Size |
|---|---|
|
|
370.65 KB |