

Release Date :
Reference Number :
WPR-2025-104
Based on the 2022 Community-Based Monitoring System (CBMS) rollout conducted in 2022, the Municipality of Magallanes had a total responding household of 4,582 with a total population of 19,397.
Average household size
The average household size recorded in the Municipality of Magallanes was 4.23 while the average family size was 4.22.
Basic services
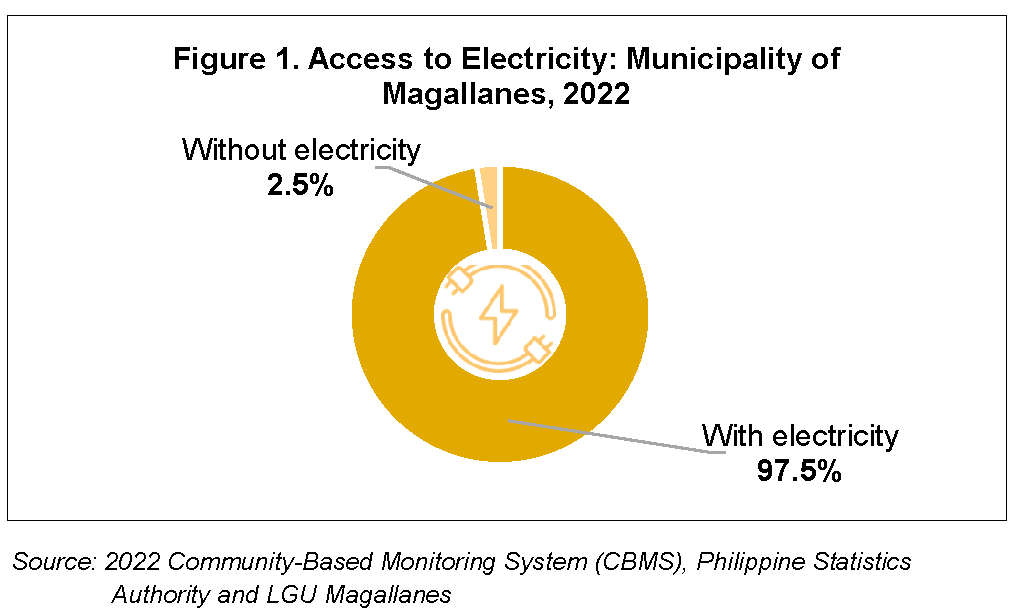
CBMS collects household information on basic services such as access to electricity and internet connection. Among the 4,582 households, 97.5 percent of households had access to electricity in their dwelling units, while 2.3 percent of households reported that they did not have access to electricity. (Figure 1)
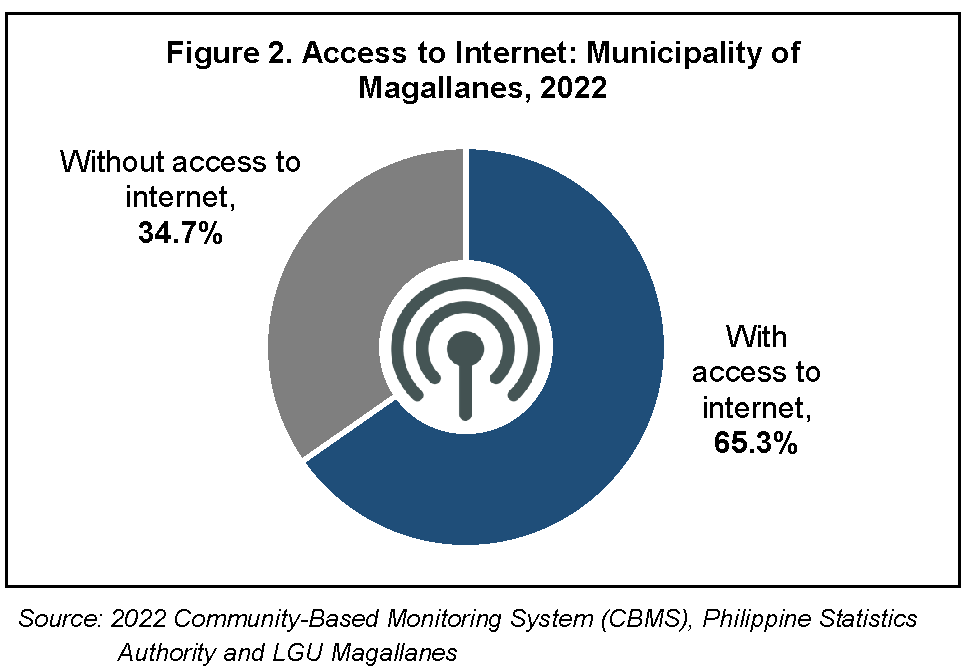
In terms of internet access, 65.3 percent of households in the municipality have their own internet connections accessible at home. Meanwhile, 34.7 percent or 1,592 out of 4,582 households covered in the 2022 CBMS did not have access to the internet as of 01 July 2022. (Figure 2)
CBMS also covers the main sources of water for general use and drinking purposes of every household. In the Municipality of Magallanes, 75.1 percent of households had their water piped into dwelling. Meanwhile, 6.7 percent sourced their water from protected well/tube well/borehole, 6.6 percent sourced their water for general purposes from community water system piped into public tap, and 11.5 percent from other sources such as yard/plot, developed spring, unprotected (open dug well), tanker truck/peddler/neighbor, and among others. (Figure 3)

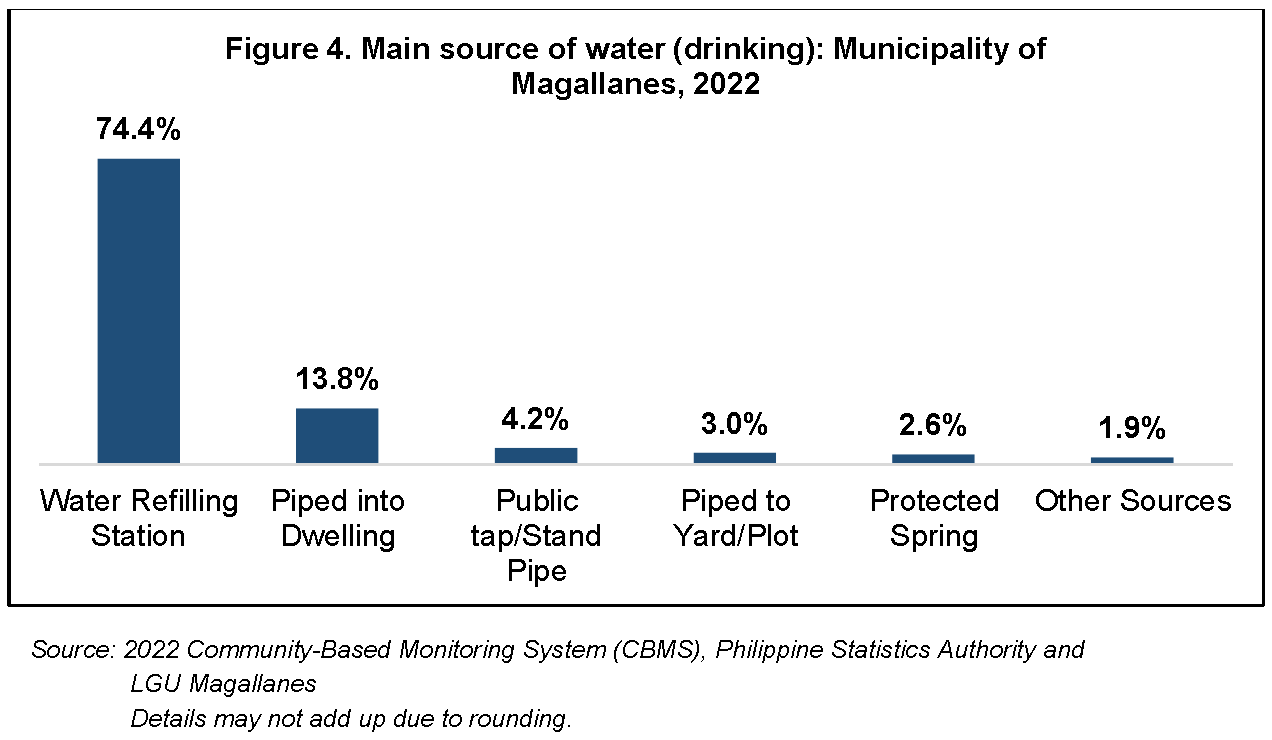
As for the main source of drinking water, 631 in 4,582 or 13.8 percent of house-holds in the municipality had drinking water sourced from pipes leading to their re-spective dwellings while 74.4 percent sourced their water for drinking from water refilling stations. On the other hand, 4.2 percent had their drinking water source from public tap/stand pipe, 3.0 percent had pipes leading to their yard/plot, and 2.6 percent from protected spring. (Figure 4)
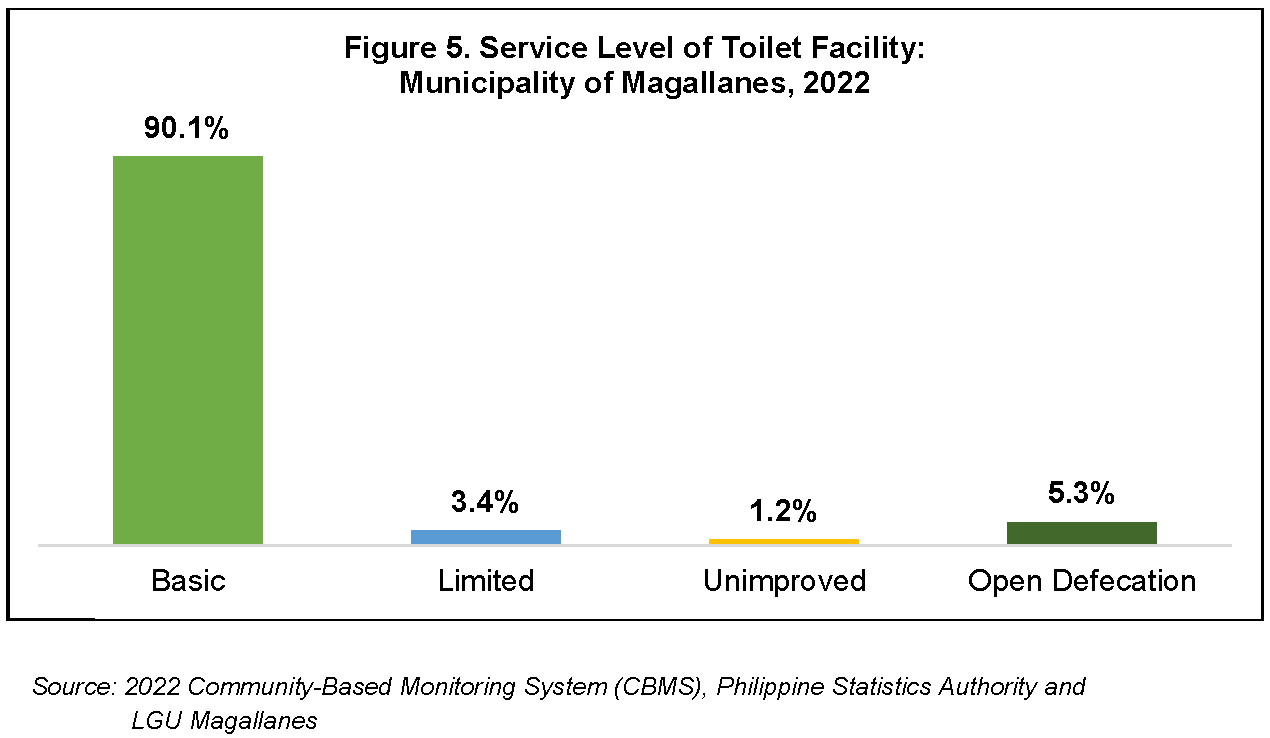
Another significant section covered in the CBMS are the service levels of toilet facilities used in 4,582 households. The Municipality of Magallanes had 90.1 per-cent or 4,129 households that have hygienic/basic sanitation facilities not shared with other households, 3.4 percent (154 households) had hygienic sanitation facili-ties but shared these with other households, and 1.2 percent (57 households) had pit latrines without cover, hanging latrines, bucket latrines, or with so-called unimproved toilet facilities. Open defecation or disposal of wastes in open spaces, bod-ies of water and fields was practiced by 5.3 percent of households as of 01 July 2022 which is equivalent to 242 households. (Figure 5)
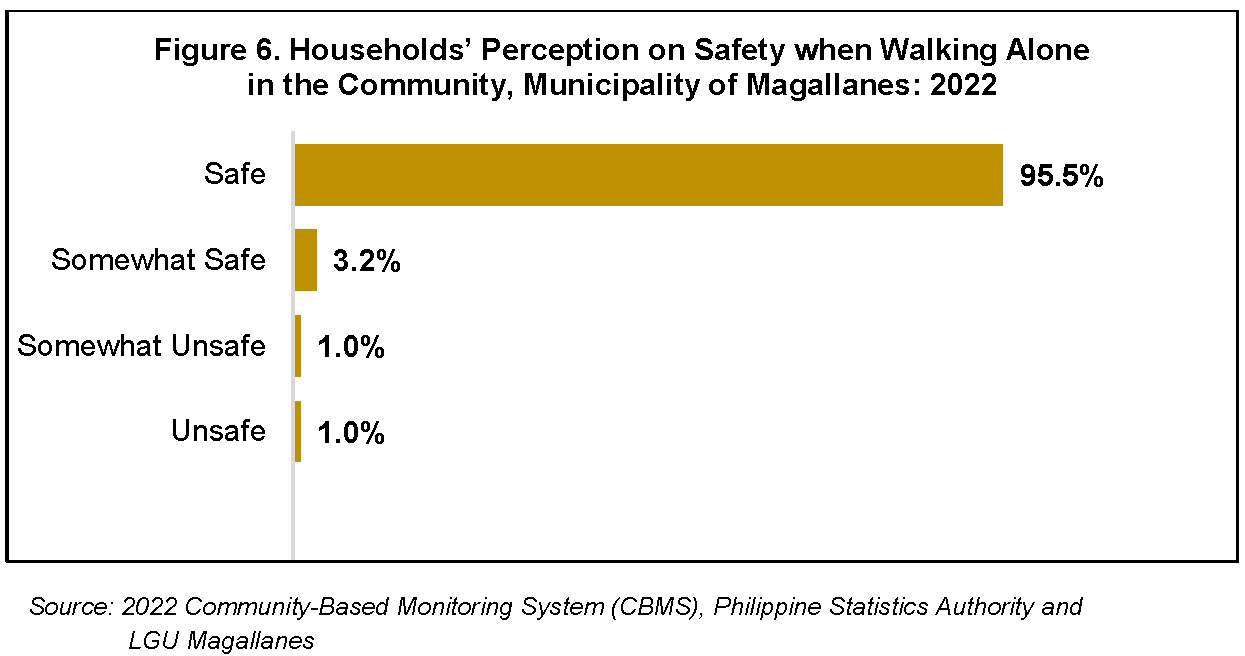
Safety
To get a glimpse of the residents’ perception of safety and security within the municipality, questions on crime and safety are also covered in the data collection process. In the Municipality of Magallanes, 95.5 percent of the households indicated that they felt safe walking alone within their own communities at night while 3.2 percent of the household respondents said that they felt somewhat safe. About 57 households perceived that their neighborhoods were somewhat unsafe or unsafe. (Figure 6)
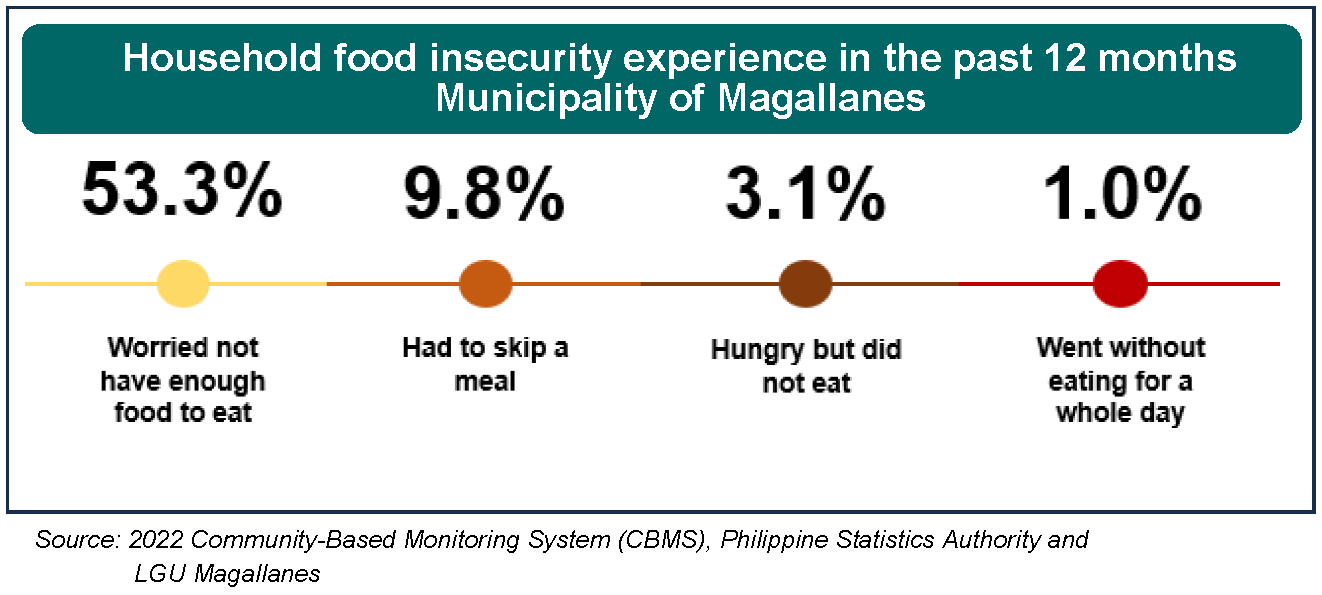
Food insecurity
Food Insecurity has continuously been an alarming concern for every city/municipality. With this, CBMS includes questions that measure the household’s level of food insecurity to aid Local Government Units in crafting programs and plans that addresses the concern. Questions have varying levels to which the household experiences it within the reference period, provided that it is mainly due to lack of money or other resources.
When asked about questions on food security from 01 July 2021 to 30 June 2022, 53.3 percent of household respondents said that at least once during the period they worried about not having food to eat. Meanwhile, 9.8 percent responded that they had to skip a meal at least once in the past 12 months, 3.1 percent said that they felt hungry but did not eat, and 1.0 percent of the households went without eating for a whole day at least once in the past 12 months.
School attendance
Besides household information, CBMS also collects information on individuals such as their socio-demographic characteristics. One important sector examined is education.
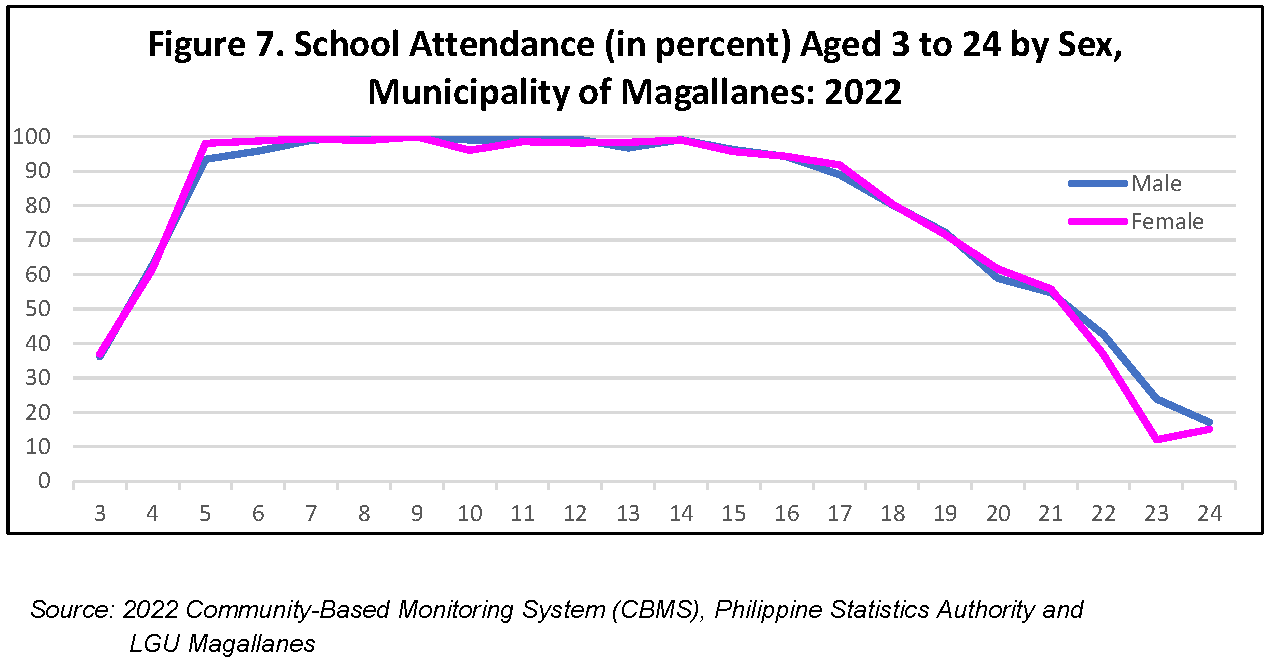
Figure 7 shows the percentage of children & youth enrolled specifically, between ages 3 to 24 and by sex. The graph shows an increasing trend as the age increas-es from 3 years old to 5 years old. A sharp rise is also evident in the percentage of persons or children attending school for both sexes.
Almost all persons aged 5 years old to 15 years old were attending school.
In terms of school attendance rates, females and males have a consistent rate of more than 95 percent between 5 to 15 years old. The gap in attendance rate between males and females starts to appear by age 17 years old; and such widens until 24 years old, where more males attending school was recorded than females. At ages 23 and 24 years old, however, we can see that at the time of 2022 CBMS there were more males attending school than females.
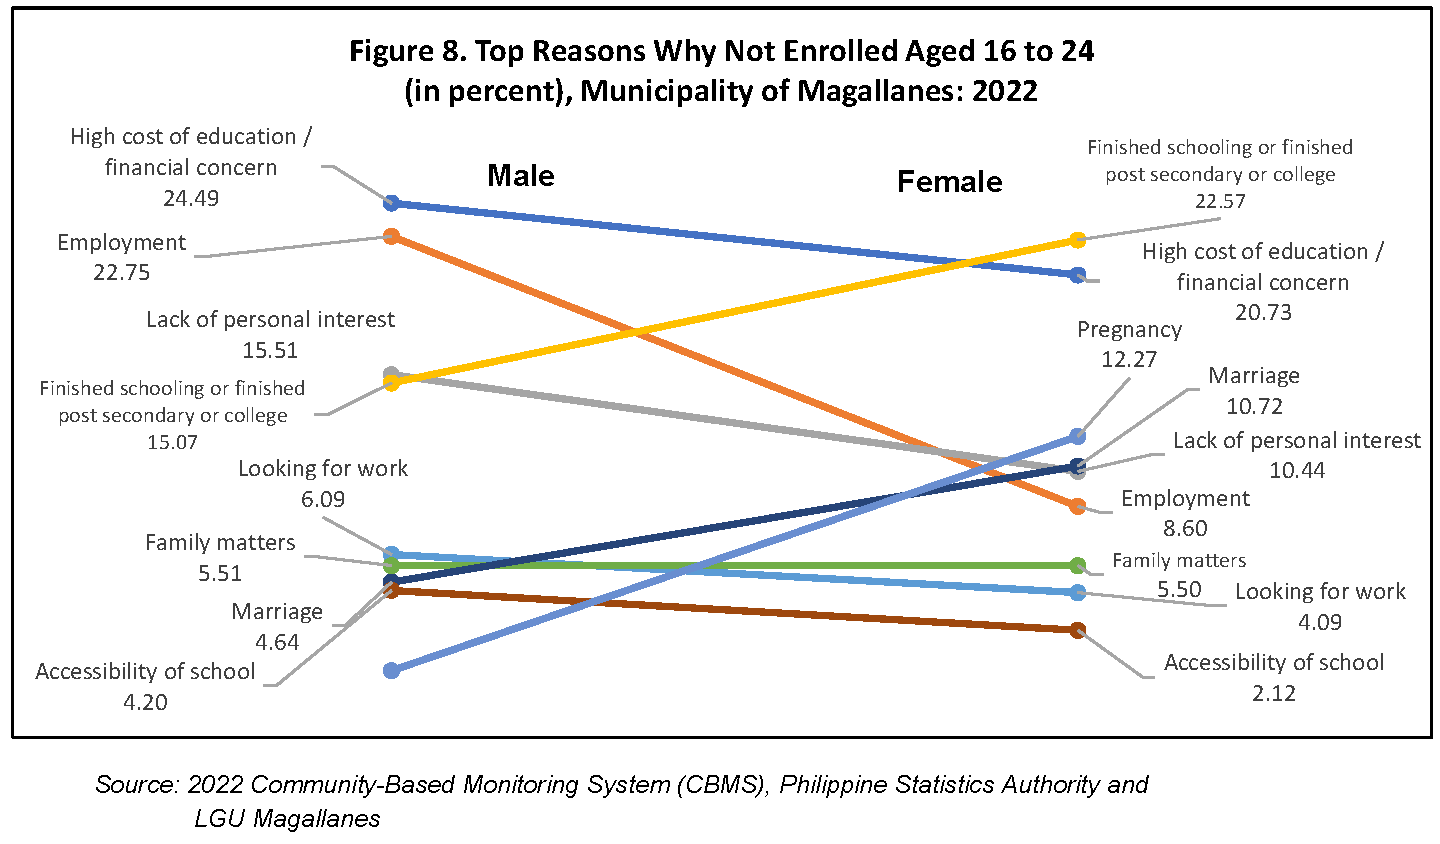
Reasons for not continuing school were provided by those household members not currently or have stopped attending school. For males with ages 16 to 24 years old, the topmost reason for not attending school is high cost of education/financial con-cern while for female is finished schooling or finished post-secondary or college.
The other three top reasons among males in the said age group are employment, lack of personal interest, and finished schooling or finished post-secondary or col-lege. Among females in the same age group, high cost of education/financial concern was the reason of the 20.7 percent of females for not attending school. This is fol-lowed by pregnancy and marriage. (Figure 8)
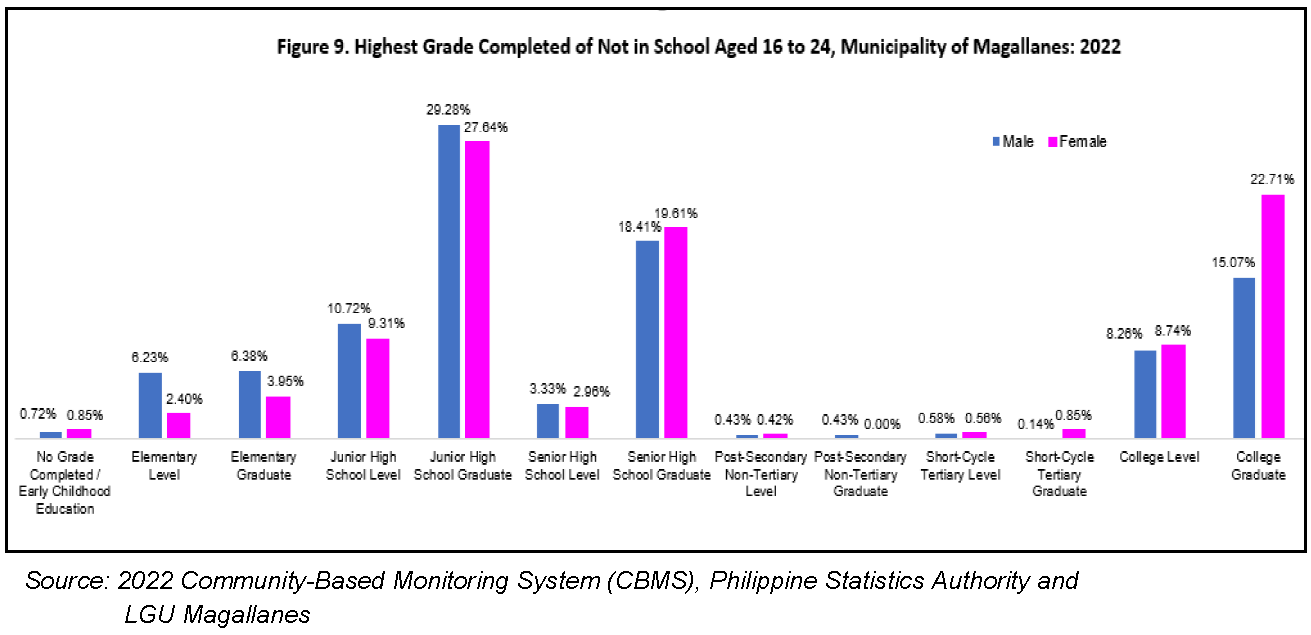
Aside from the reasons, the highest grades completed by those who are not currently in school or who have stopped attending school were also collected in CBMS. Of those males who are not in school, 29.3 percent or 202 in 690 were in junior high school graduates while 196 of 709 (27.6 percent) females who are not in school are in junior high school graduates. (Figure 9)
Labor and economic indicators such as labor force participation and status of employment were collected to give local government units a gauge on the engage-ment of its residents in various economic activities.
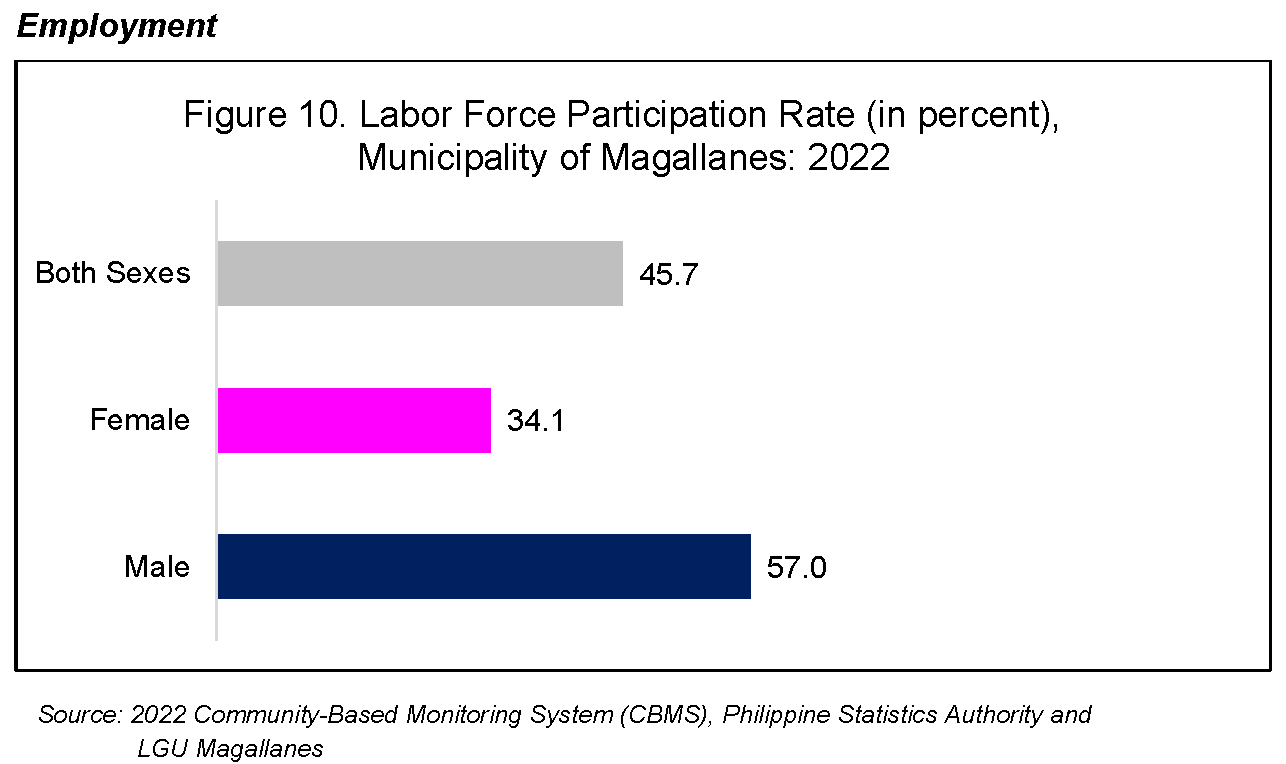
Out of 13,976 persons with ages 15 years old and over, 45.7 percent are in the labor force where 34.1 percent of females in the said age group are in the labor force, while 57.0 percent of males were in the labor force. (Figure 10)
As for the employment status of residents in Magallanes, of those in the labor force, 91.1 percent were employed, i.e with job or business during the reference period.
On the other hand, 90.8 percent of females were employed while 91.3 percent of males were employed. These statistics also meant that there were 567 persons who are unemployed in July 2022 in the said municipality.
Main construction material
In the global methodology for Multidimensional Poverty Index, construction materials of the roof, outer walls and floor are indicators to determine which households are with deprivation in living standards. Such information is also important to determine which households are highly vulnerable to typhoons and earthquakes’ negative impacts.
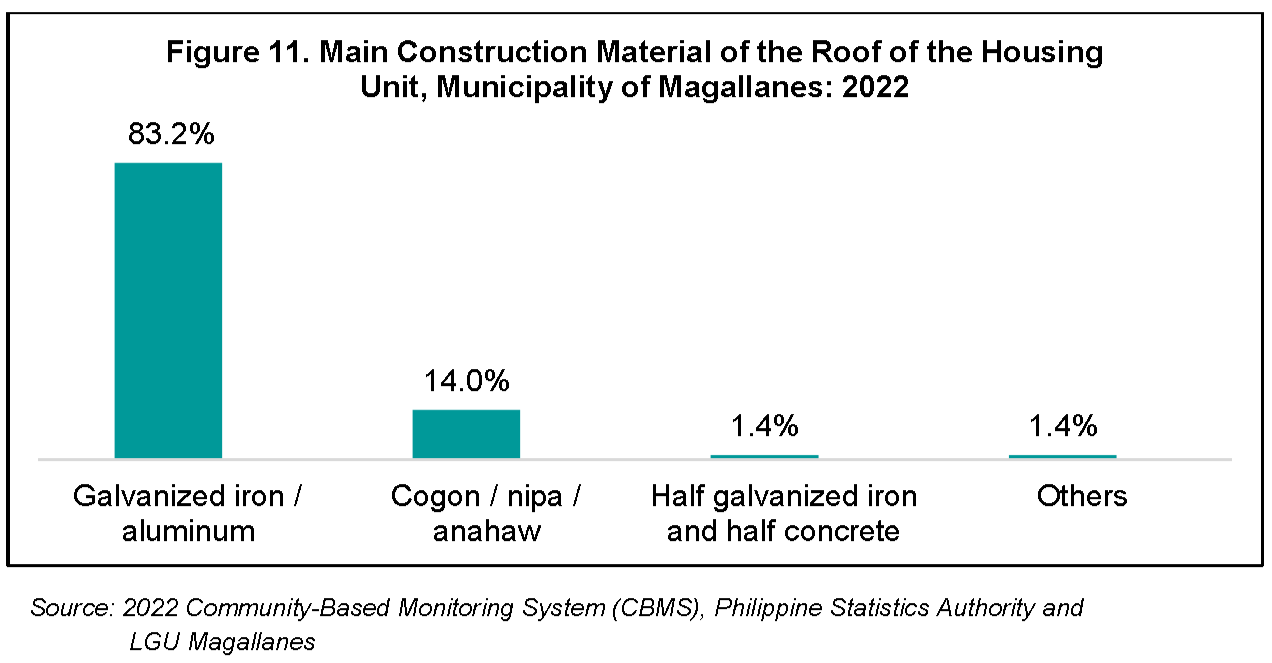
With this in consideration, various housing materials used in the floors, walls, and roofs of residents in Magallanes were determined through the CBMS enumeration. In terms of construction materials of roof, a majority of household (83.2 percent) lived in dwelling units made of galvanized iron/aluminum. However, 640 households in the municipality lived in housing units with roofs made of wood/bamboo, co-gon/nipa/anahaw (14.0 percent) and 64 households (1.4 percent) made of half galvanized iron and half concrete.
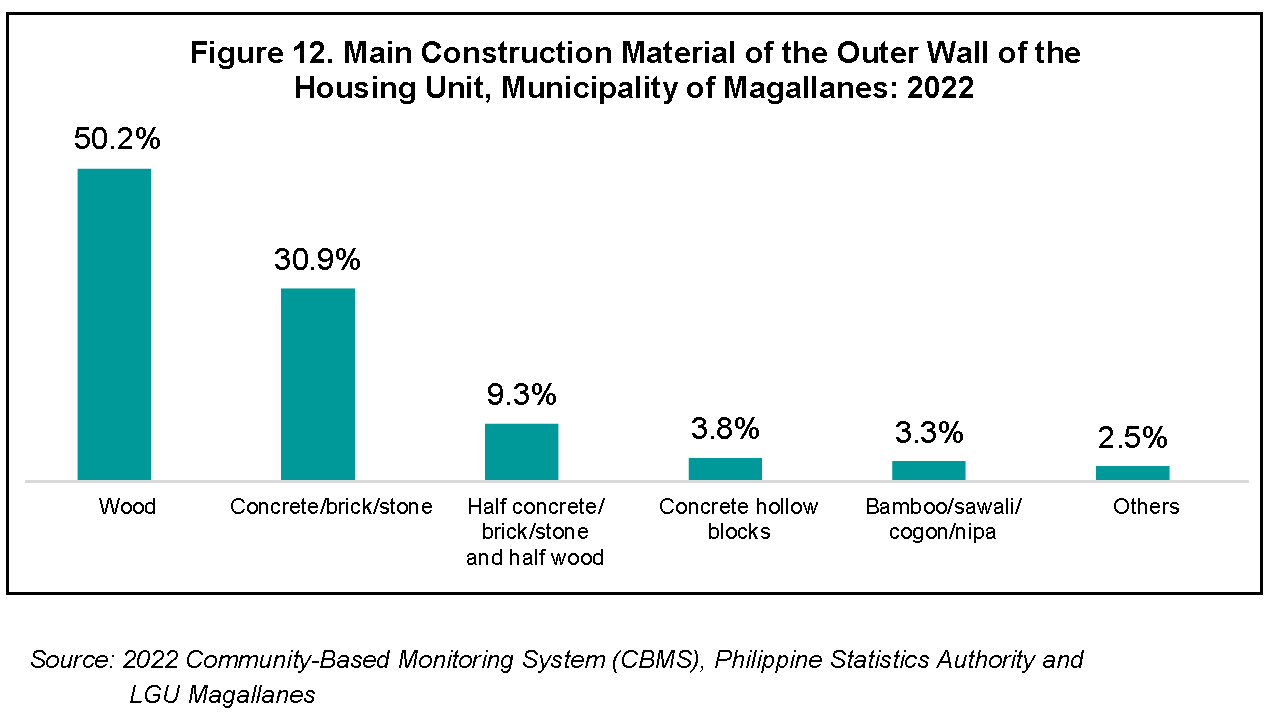
For the Municipality of Magallanes, 4,359 households (95.1 percent) used strong materials for the outer walls of the housing unit/building they occupied. Strong materials consist of concrete/brick/stone, wood, half concrete/brick/stone and half wood, galvanized iron/aluminum, asbestos, glass, concrete hollow blocks, concrete hollow blocks/wood, and shear walls while light materials include bamboo/sawali/cogon/nipa, makeshift/salvaged/improvised materials, none, and other light materials.
TECHNICAL NOTES
The Community-Based Monitoring System (CBMS) is an organized technology-based system of collecting, processing, and validating necessary disaggregated da-ta, that may be used for planning, program implementation, and impact monitoring at the local level while empowering communities to participate in the process. The Philippine Statistics Authority (PSA) is mandated to implement the CBMS by virtue of Republic Act No. 11315. The CBMS Council as cited in the Section XI of the Im-plementing Rules and Regulations (IRR) are composed of the PSA, Department of Interior Local and Government (DILG), and Department of Information and Communi-cations Technology (DICT). The CBMS was conducted in August 2022 with 01 July 2022 as reference date.
Household is a social unit consisting of person or a group of persons who sleep in the same housing unit and have a common arrangement in the preparation and consumption of food.
Household population refers to all persons who are members of the household.
Sex is the biological and physiological reality of being a male or female.
Age refers to the interval of time between the person’s date of birth and his/her last birthday prior to the census reference date. It is expressed in completed years or whole number.
Service Level of Toilet Facility
Basic – sanitation facility designed to hygienically separate excreta from human con-tact, not shared with other households.
Limited – sanitation facility designed to hygienically separate excreta from human contact, shared with households.
Unimproved – pit latrines without a slab or platform, hanging latrines or bucket la-trines.
Open defecation – disposal of human feces if fields, forests, bushes, open bodies of water, beaches and other open spaces or with solid waste.
Approved by:
(Sgd.) REYNELO S. MAGNO
Chief Statistical Specialist, PSO – Agusan del Norte
Telephone number: (085) 817-3193 / Telefax No.: (085) 225-2097
Email address: agusandelnorte@psa.gov.ph
| Attachment | Size |
|---|---|
|
|
521.51 KB |