

Release Date :
Reference Number :
WPR-2025-267
A. Caraga
1. Overall Inflation
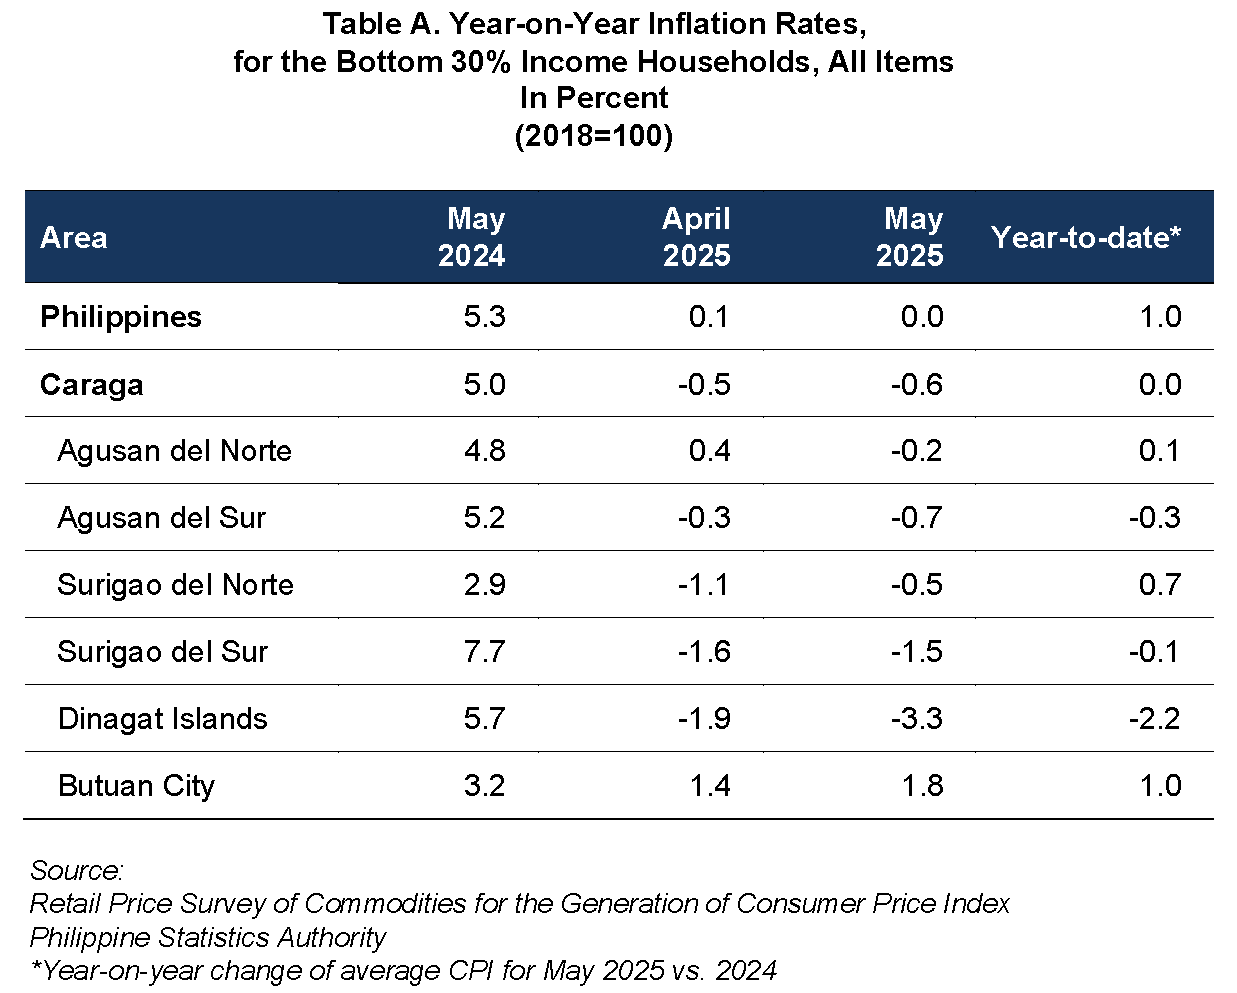
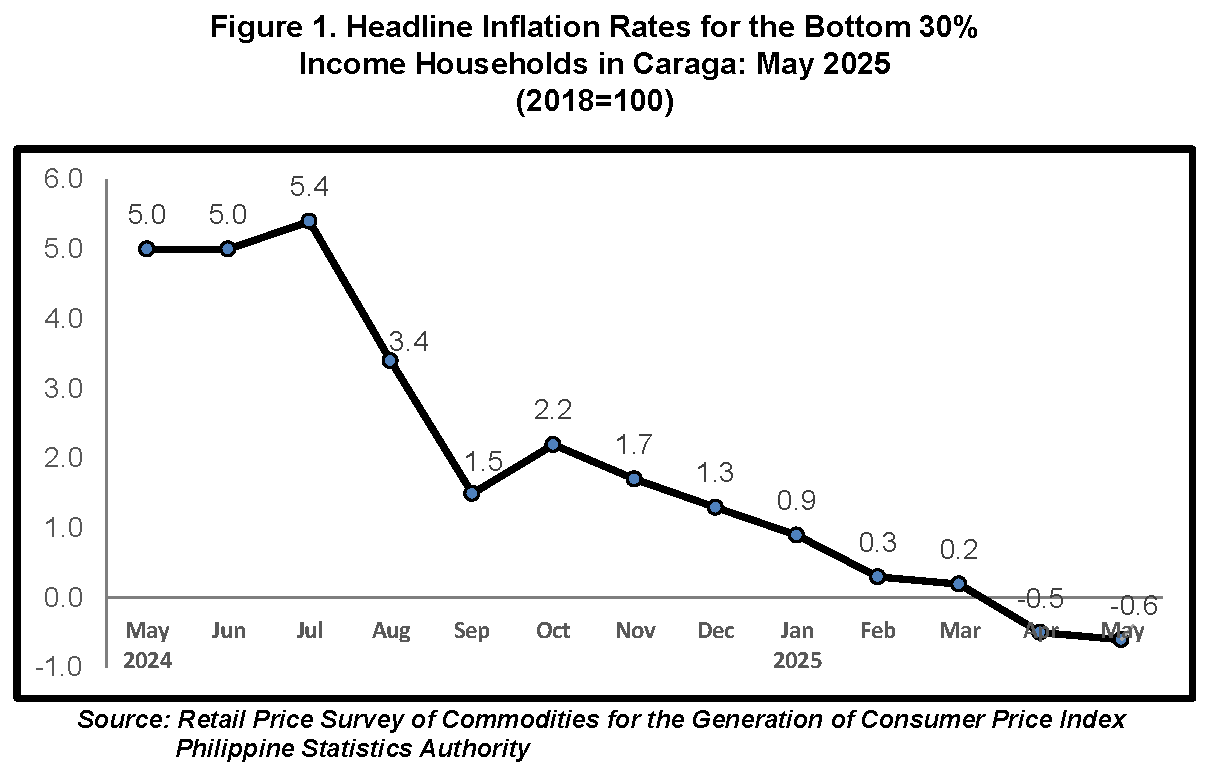
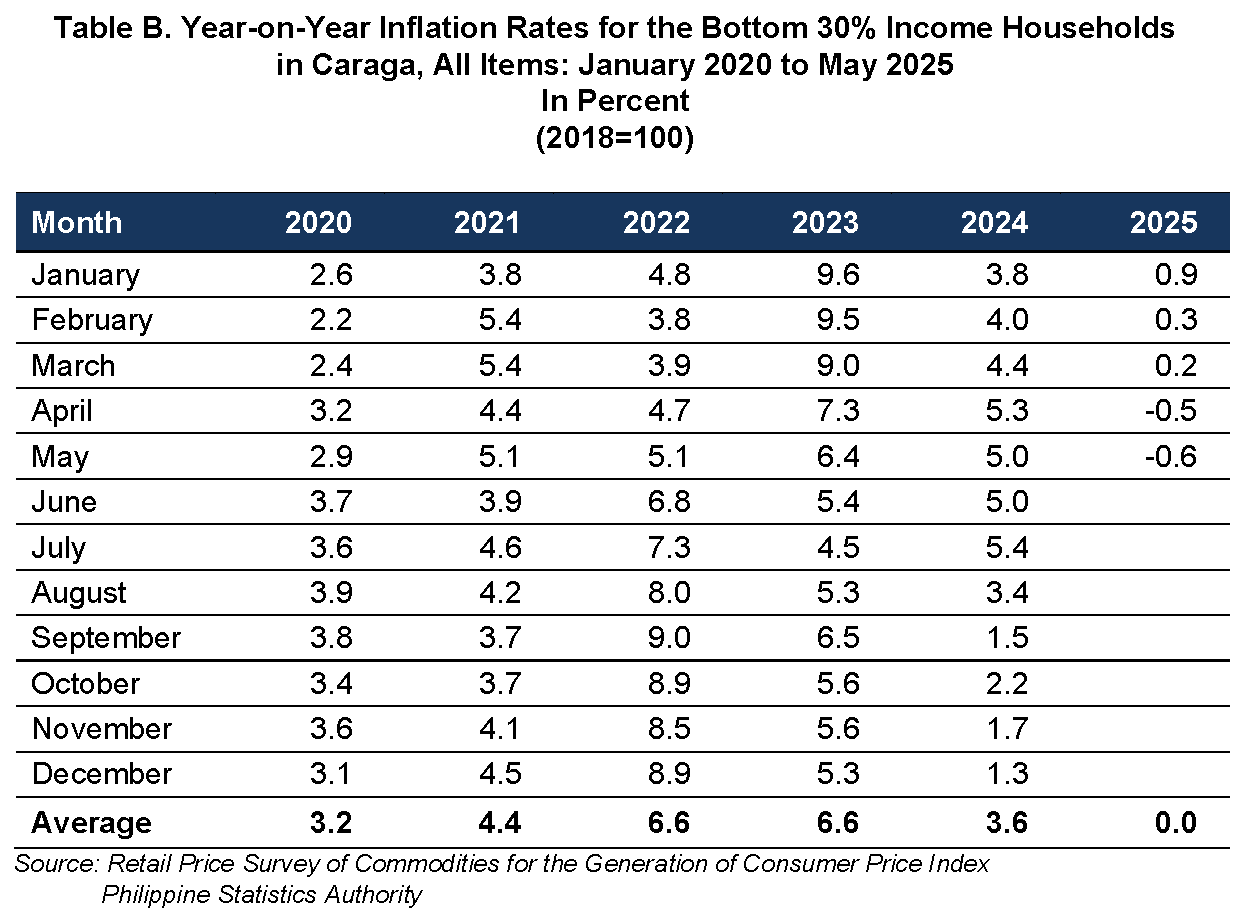
Inflation Rate for Bottom 30% Income Households Declines to -0.6 percent in May 2025
The -0.6 percent inflation in May 2025 for the bottom 30% income households in the region is a decline from -0.5 percent in April 2025. This represents a substantial decrease from 5.0 percent recorded in May 2024. (Refer to Figure 1, Tables A and B)
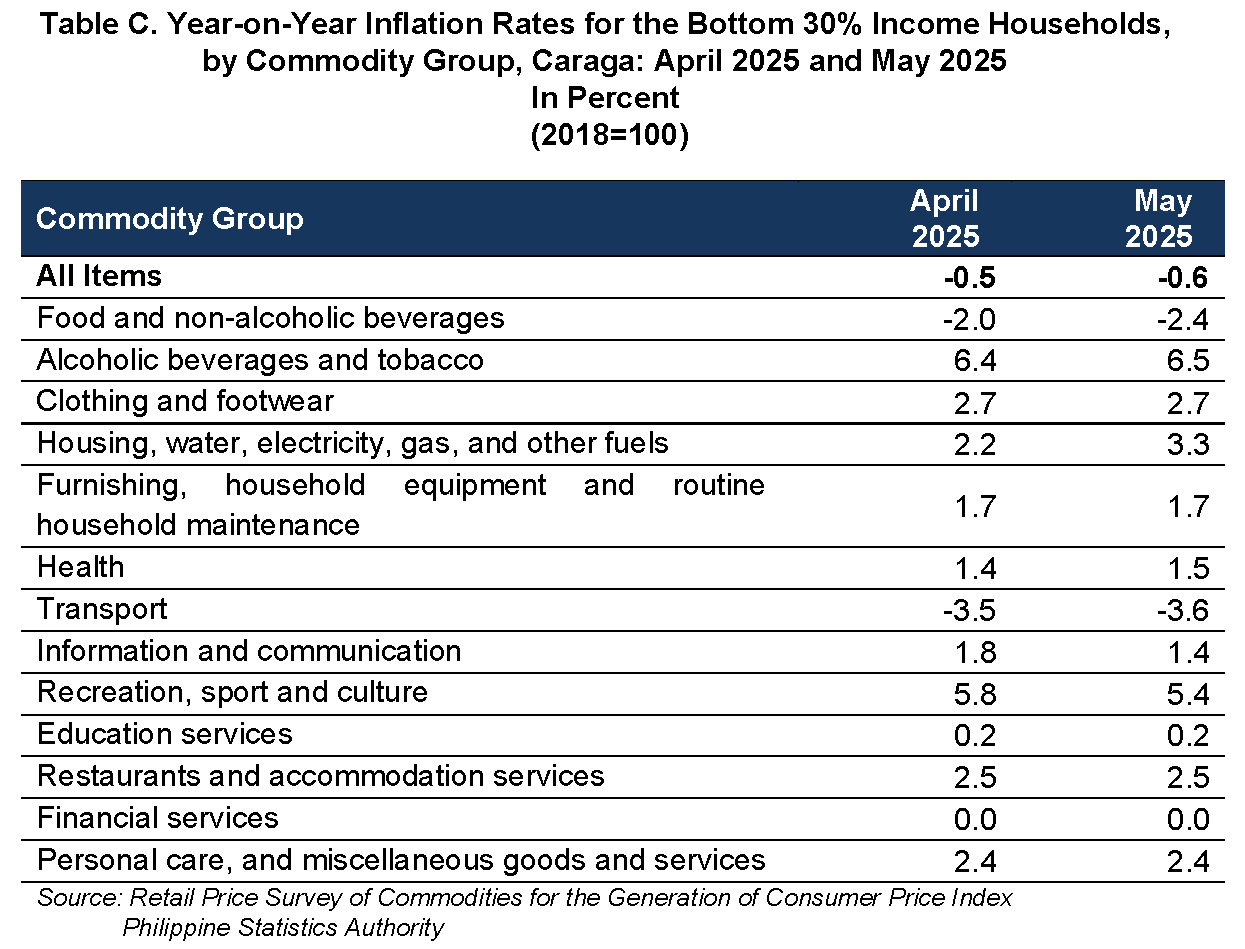
The primary driver of this deceleration was the pronounced decline in the year-on-year growth rate of prices in the Food and Non-Alcoholic Beverages group. Inflation in this category dropped further to -2.4 percent in May 2025, from -2.0 percent in the previous month. A key factor behind this trend was the significant reduction in rice prices, which posted an inflation rate of -16.5 percent, compared to -14.8 percent in April 2025. The Food and Non-Alcoholic Beverages group alone accounted for approximately 95.0 percent of the overall inflation decline for this income group.
Other Commodity Groups with declining inflation
A. Transport:
Inflation in the Transport category further declined to -3.6 percent in May 2025 from -3.5 percent in April 2025. This decrease was primarily driven by lower gasoline prices, which posted an inflation rate of -13.6 percent this month from -12.4 percent in the previous month.
B. Information and Communication:
Inflation in the Information and Communication category also declined, registering at 1.4 percent in May 2025, down from 1.8 percent in April 2025.
C. Recreation, Sport and Culture:
Inflation in this group experienced a further decline, easing to 5.4 percent in May 2025 from 5.8 percent in the previous month.
On the contrary, the following commodity groups recorded increased inflation rates in May 2025:
1. Alcoholic Beverages and Tobacco, at 6.5 percent from 6.4 percent;
2. Housing, Water, Electricity, Gas and Other Fuels, at 3.3 percent from 2.2 percent; and
3. Health, at 1.5 percent from 1.4 percent.
Meanwhile, commodity groups retained their respective inflation rates from April 2025 to May 2025:
1. Clothing and Footwear, at 2.7 percent;
2. Furnishings, Household Equipment and Routine Household Maintenance, at 1.7 percent;
3. Education Services, at 0.2 percent;
4. Restaurants and Accommodation Services, at 2.5 percent;
5. Financial Services, at 0.0 percent; and
6. Personal Care, and Miscellaneous Goods and Services, at 2.4 percent.
B. Food Inflation
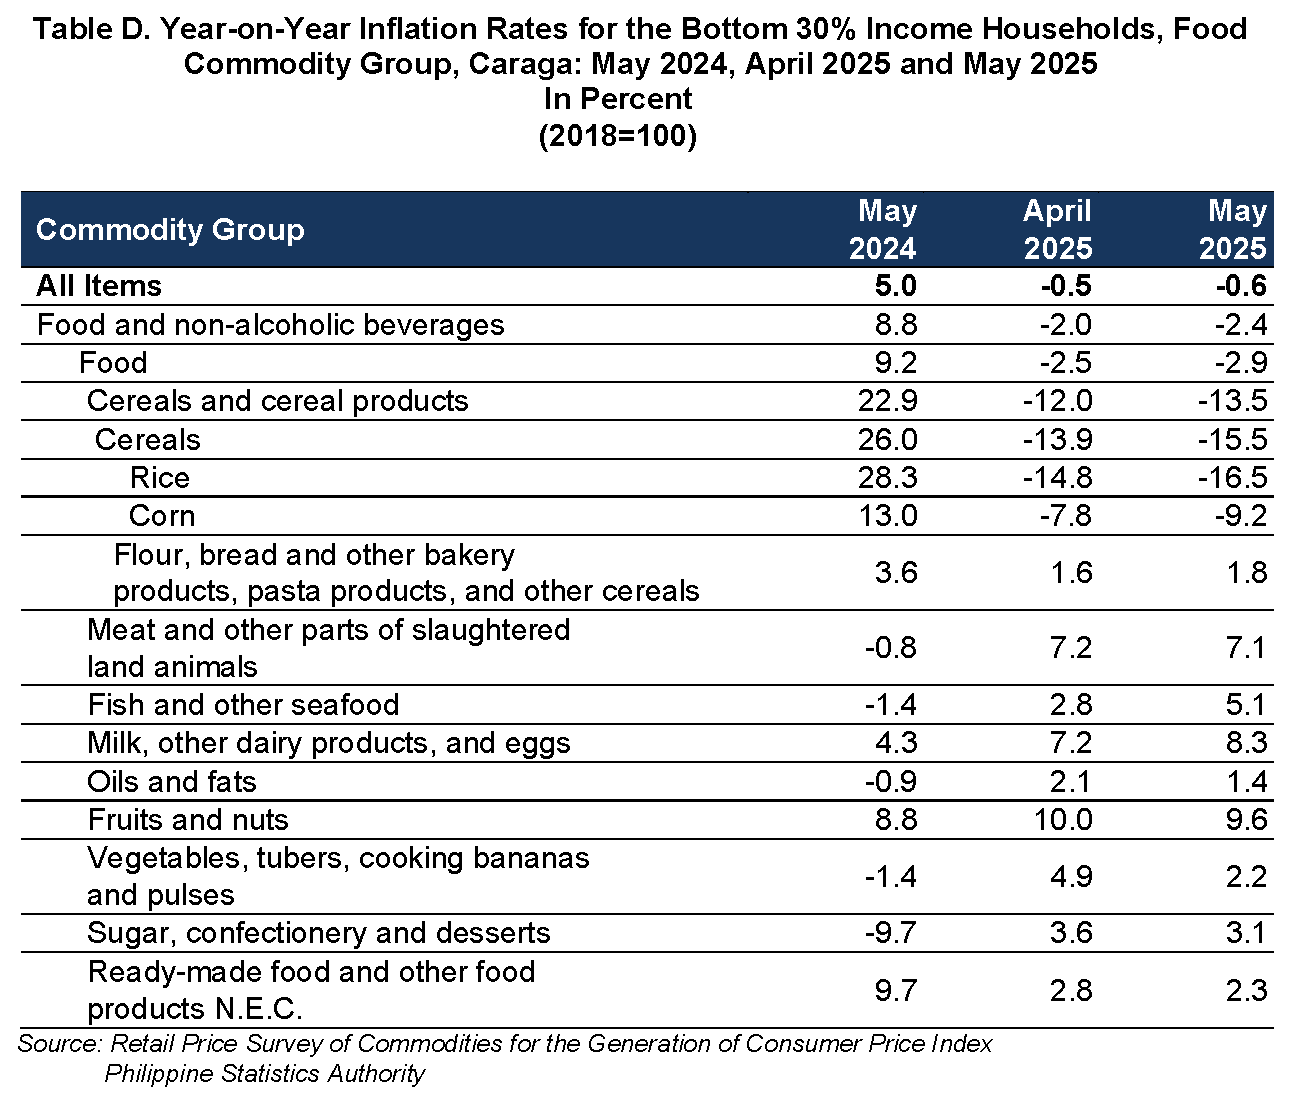
Food Inflation for Bottom 30% Income Households Fell to -2.9 Percent in May 2025
Food inflation for the bottom 30% income households at the regional level declined to -2.9 percent in May 2025, from -2.5 percent in April 2025. This represents a substantial decrease from 9.2 percent in April 2024 (refer to Table D).
Among the food groups, the primary contributor to the downtrend in food inflation was Cereals and Cereals Products, with inflation dropping to -13.5 percent from -12.0 percent in April 2025. This was mainly driven by lower rice prices, which recorded an inflation rate of -16.5 percent in May, compared to -14.8 percent in the previous month. This food group alone accounted for approximately 74.6 percent of the overall downward inflation trend for this income group.
In addition, the deceleration inflation for the Vegetables, tubers, plantains, cooking bananas and pulses group, also contributed to the overall slowdown. Inflation in this category eased to 2.2 percent in May, from 4.9 percent in the April 2025, contributing around 19.4 percent to the overall decline in food inflation.
Other Food groups with lower inflation in May 2025:
A. Meat and other parts of slaughtered land animals: Decreased to 7.1 percent from 7.2 percent;
B. Oils and fats: Decreased to 1.4 percent from 2.1 percent;
C. Fruits and nuts: Decreased from 9.6 percent from 10.0 percent;
D. Vegetables, tubers, plantains, cooking bananas and pulses: Down to 2.2 percent from 4.9 percent;
E. Sugar, confectionery and desserts: Decrease to 3.1 percent from 3.6 percent;
F. Ready-made food and other food products: Decreased to 2.3 percent from 2.8 percent; and
G. Corn: Down to -9.2 percent from -7.8 percent.
Food groups with higher inflation in May 2025:
A. Flour, Bread and Other Bakery Products, Pasta Products, and Other Cereals: Increased to 1.8 percent from 1.6 percent;
B. Fish and other seafood; Rose to 5.1 percent from 2.8 percent; and
C. Milk, other dairy products and eggs: Increased to 8.3 percent from 7.2 percent.
C. Provinces and Highly Urbanized City (HUC)
In May 2025, inflation varies across all five provinces and Highly Urbanized City (HUC) in the region. Among all areas, Butuan City (HUC) registered the highest inflation rate at 1.8 percent while Dinagat Islands recorded the lowest at -3.3 percent in May 2025 (Refer to Table A).
Note:
CPIs and inflation rates by province and selected city are posted on the PSA website (http://openstat.psa.gov.ph/).
(Sgd.) GUILLERMO M. LIPIO, JR.
(Chief Statistical Specialist)
Officer-In-Charge
PSA RSSO XIII
| Attachment | Size |
|---|---|
|
|
2.94 MB |