

Release Date :
Reference Number :
SR-2024-0027
Summary Inflation Report Consumer Price Index Bottom 30% Income Households (2018=100) March 2024
A. Caraga
1. Overall Inflation
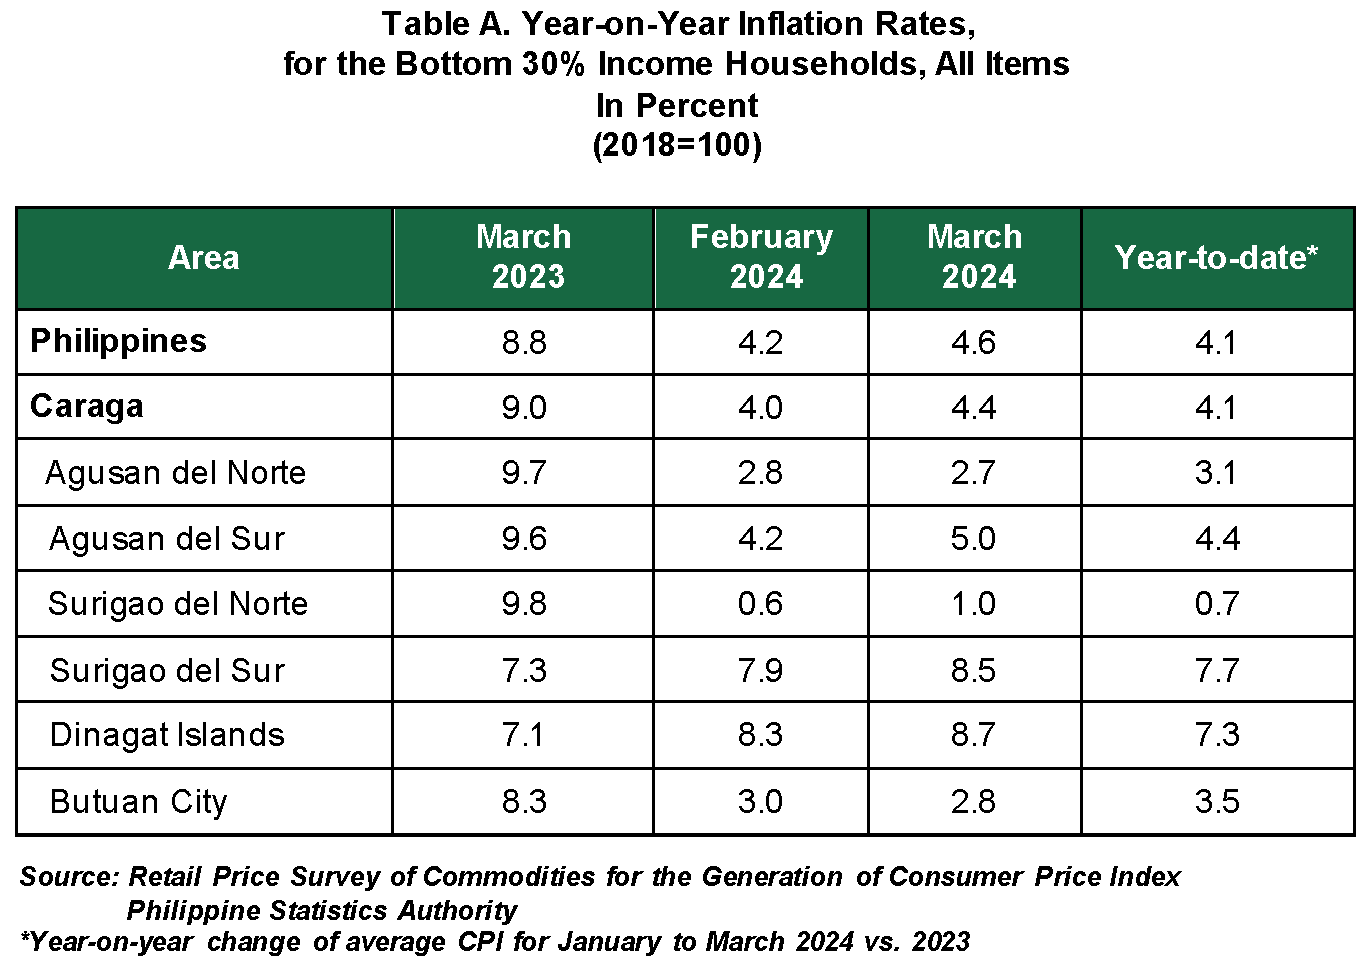
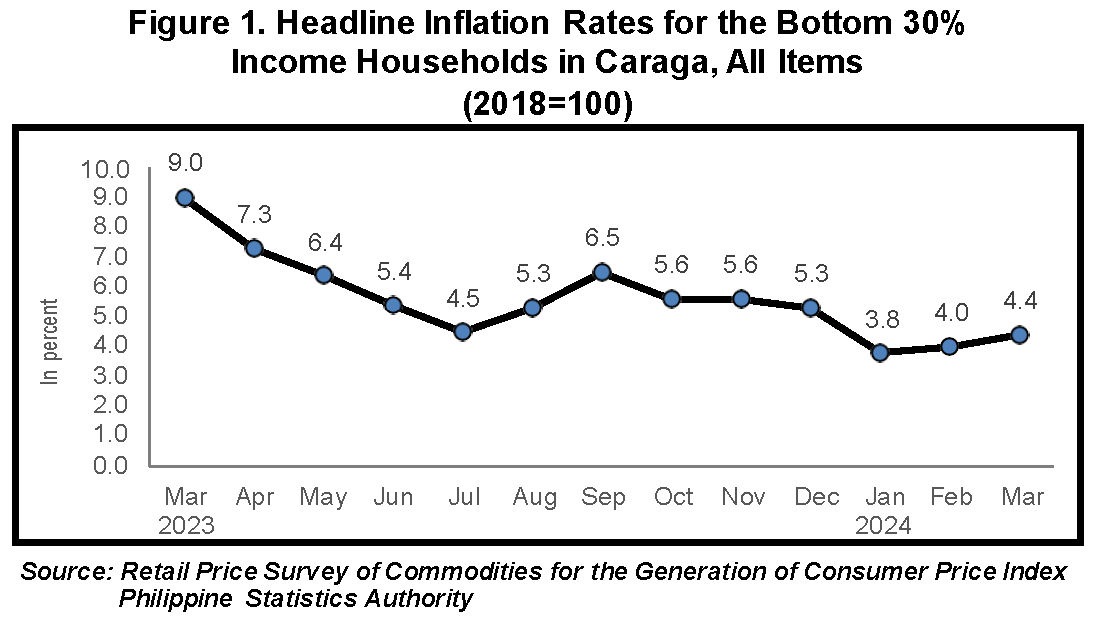
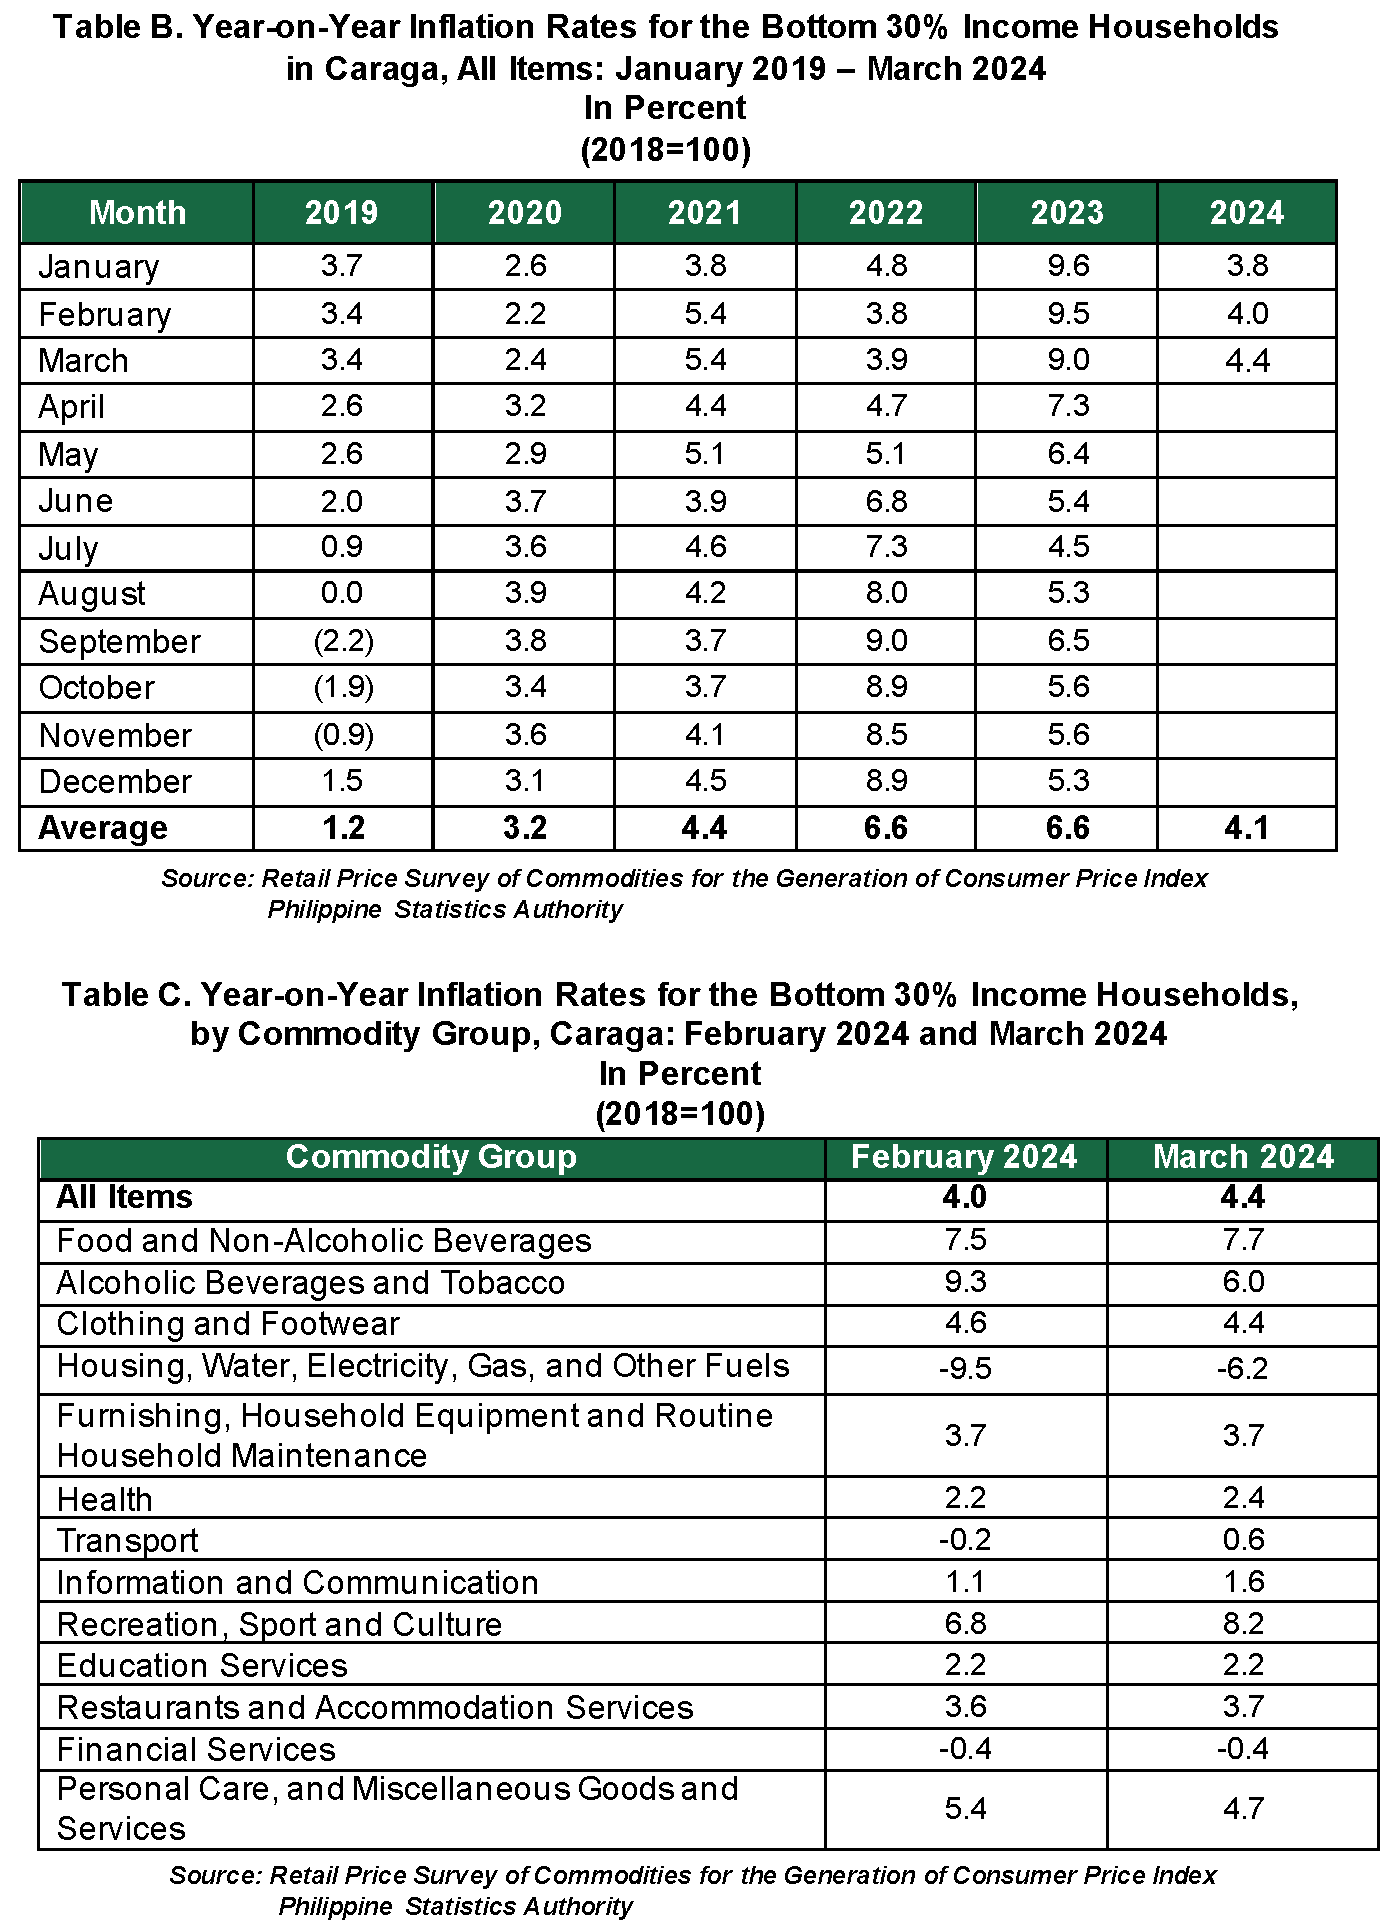
The region’s inflation rate for the bottom 30% income household increased further to 4.4 percent in March 2024 from 4.0 percent in February 2024. In March 2023, inflation rate was posted at 9.0 percent. (Figure 1, Table A, and B)
The main driver to the upward trend of the overall inflation for this income group in March 2024 was the higher year-on-year growth in housing, water, electricity, gas and other fuels at -6.2 percent from -9.5 percent in the previous month. This was followed by food and non-alcoholic beverages, which posted at 7.7 percent inflation rate during the month from 7.5 percent in February 2024. Higher annual increments were also noted in the indices of transport, which was recorded at 0.6 percent during the month from -0.2 percent in February 2024.
Other commodity groups that contributed to the uptrend in the March 2024 inflation were as follows:
a. Recreation, sport & culture, 8.2 percent;
b. Restaurants and accommodation services, 3.7 percent;
c. Information and communication, 1.6 percent; and
d. Health, 2.4 percent.
In contrast, lower inflation rates were noted in the indices of the following commodity groups during the month:
a. Alcoholic beverages and tobacco, 6.0 percent;
b. Clothing and footwear, 4.4 percent; and
c. Personal care, and miscellaneous goods and services, 4.7 percent.
The indices of the rest of the commodity groups retained their respective previous month’s annual growth rates were observed in the following commodity groups:
a. Furnishings, household equipment, and routine household maintenance, 3.7 percent;
b. Education services, 2.2 percent; and
c. Financial services, -0.4 percent.
2. Food Inflation
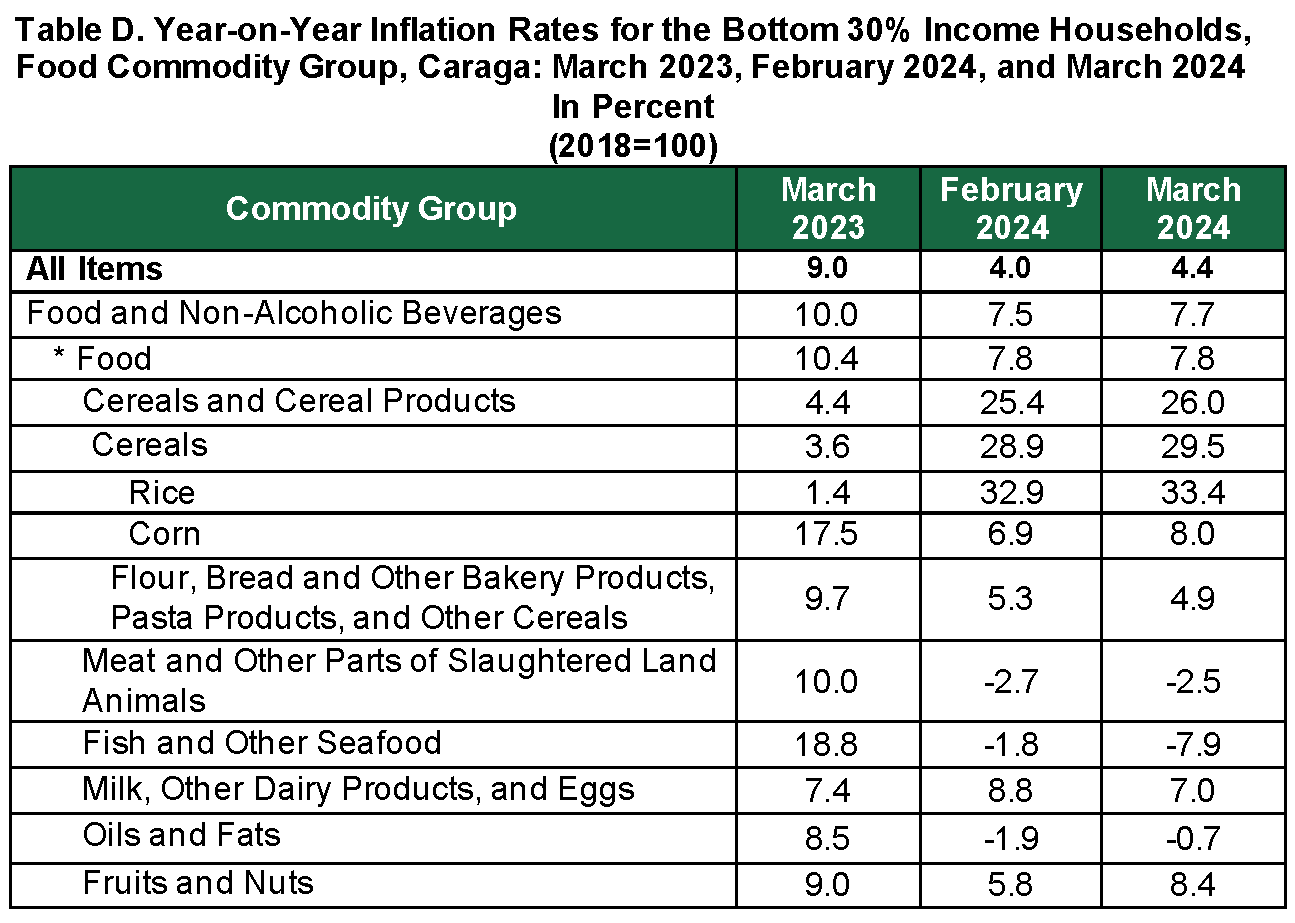
Overall food inflation for the bottom 30% income households at the regional level retained to previous month’s rate at 7.8 percent. In March 2023, food inflation was higher at 10.4 percent. (Table D)
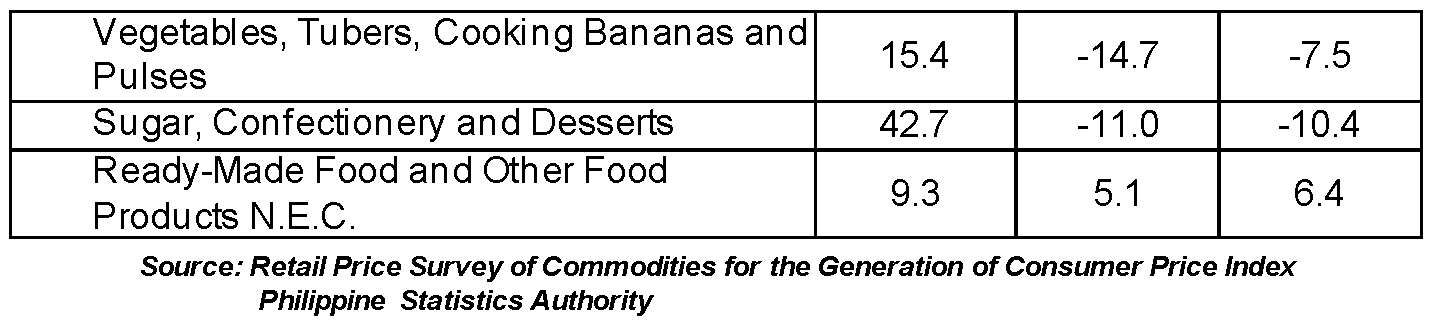
Majority of the food groups that recorded an increase in March 2024 was mainly influenced by the higher year-on-year growth rate observed in cereals and cereal products (ND) which includes rice and corn at 26.0 percent from 25.4 percent in the previous month. This was followed by fruits and nuts posted at 8.4 percent from 5.8 percent in the previous month. In addition, ready-made food and other food products
n.e.c. index recorded a faster annual increment of 6.4 percent from 5.1 percent in February 2024.
Other food groups contributed to the upward trend in the March 2024 inflation were as follows:
a. Oils and fats, -0.7 percent;
b. Sugar, confectionery and desserts, -10.4 percent;
c. Meat and other parts of slaughtered land animals, -2.5 percent; and
d. Vegetables, Tubers, Cooking Bananas and Pulses, -7.5 percent.
On the contrary, lower inflation rates were recorded during the month in the indices of the following food groups:
a. Fish and other seafood, -7.9 percent; and
b. Milk, other dairy products, and eggs, 7.0 percent.
B. Provinces and Highly Urbanized City (HUC)
In March 2024, four provinces recorded higher inflation rates for the bottom 30% income households relative to their respective inflation rates in the previous month. The main contributor to the uptrend was registered in Agusan del Sur at 5.0 percent from 4.2 percent in the previous month. Then followed by Surigao del Sur at 8.5 percent compared to the 7.9 percent from the previous month. In addition, Surigao del Norte and Dinagat Islands also registered an increasing inflation rate at 1.0 percent and 8.7 percent, from 0.6 percent and 8.3 percent, respectively.
On the contrary, Agusan del Norte and its HUC (Butuan City) registered a decreasing inflation rate to 2.7 percent and 2.8 percent, from 2.8 percent and 3.0 percent respectively.
Note:
CPIs and inflation rates by province and selected city are posted on the PSA website (http://openstat.psa.gov.ph/).
(Sgd.) ROSALINDA C. APURA, D.M.
Regional Director
PSA RSSO XIII (Caraga)
| Attachment | Size |
|---|---|
|
|
1.92 MB |